XAG/USD: Silver interest Weakens amid Reversal action

Silver (XAG/USD) drifts lower from an intraday high of $36 before reversing direction


Register now to be able to add articles to your reading list.

” aria-hidden=”true”>

Quick overview

  • Silver (XAG/USD) has drifted lower from an intraday high of $36, currently trading around $35.8.
  • Last week, silver reached 13-year highs due to its haven appeal, but recent market activity shows decreased liquidity and profit-taking.
  • The daily chart remains technically positive, with a rising trendline support near $36, but signs of weariness are emerging.
  • Momentum indicators suggest ongoing buyer-seller competition, with the RSI still bullish while the MACD shows a slight decline in short-term momentum.

Silver (XAG/USD) drifts lower from an intraday high of $36 before reversing direction.  Metal traders test important trendline support, the metal is trading close to $35.8, just above the session low of $35.3, but still down about 0.65 percent for the day.

Platinum Hits 4-Year High, Silver Tops $37 Amid Safe-Haven Shift

Traders flocked to silver because of its appeal as a haven last week, pushing the metal to new 13-year highs. Retail interest and strong industrial demand fueling the surge have weakened.. The momentum has since slowed, though, and the most recent decline affirmed decreased market liquidity and prudent profit-taking.

The greyish metals’ daily chart is still positive from a technical standpoint; however, it shows early indications of weariness. Tuesday’s decline drew XAG/USD closer to the rising trendline support towards the upward trend since the middle of April.

Market action revealed this trendline is supported by the 21-day Exponential Moving Average (EMA) $36 frequently serves as a launching pad for new purchases.
Momentum indicators highlight buyer-seller competition. The Relative Strength Index (RSI) has cooled to 56.5, but it is still comfortably above the neutral 50 level, affirming that the trend is still bullish overall.

In contrast, the MACD histogram has marginally shifted to the negative, indicating that the short-term upward momentum is abating. It is evident from recent candles with price action that frequently shows long lower wicks that bulls are still actively intervening during dips.

Olumide Adesina

Financial Market Writer

Olumide Adesina is a French-born Nigerian financial writer. He tracks the financial markets with over 15 years of working experience in investment trading.

Related Articles


Source link

Visited 1 times, 1 visit(s) today

Related Article

EUR/USD Analysis Today 26/06: Selling Recommended (Chart)

EUR/USD Analysis Today 26/06: Selling Recommended (Chart)

EUR/USD Analysis Summary Today Overall Trend: Strongly Bullish. Today’s EUR/USD Support Levels: 1.1590 – 1.1500 – 1.1420. Today’s EUR/USD Resistance Levels: 1.1680 – 1.1730 – 1.1800. EUR/USD Trading Signals: Sell EUR/USD from the resistance level of 1.1690 with a target of 1.1400 and a stop-loss at 1.1800. Buy EUR/USD from the support level of 1.1490

Nvidia Stock Price Could Soar to Hit $6 Trillion Valuation: Loop Capital

Nvidia Stock Price Could Soar to Hit $6 Trillion Valuation: Loop Capital

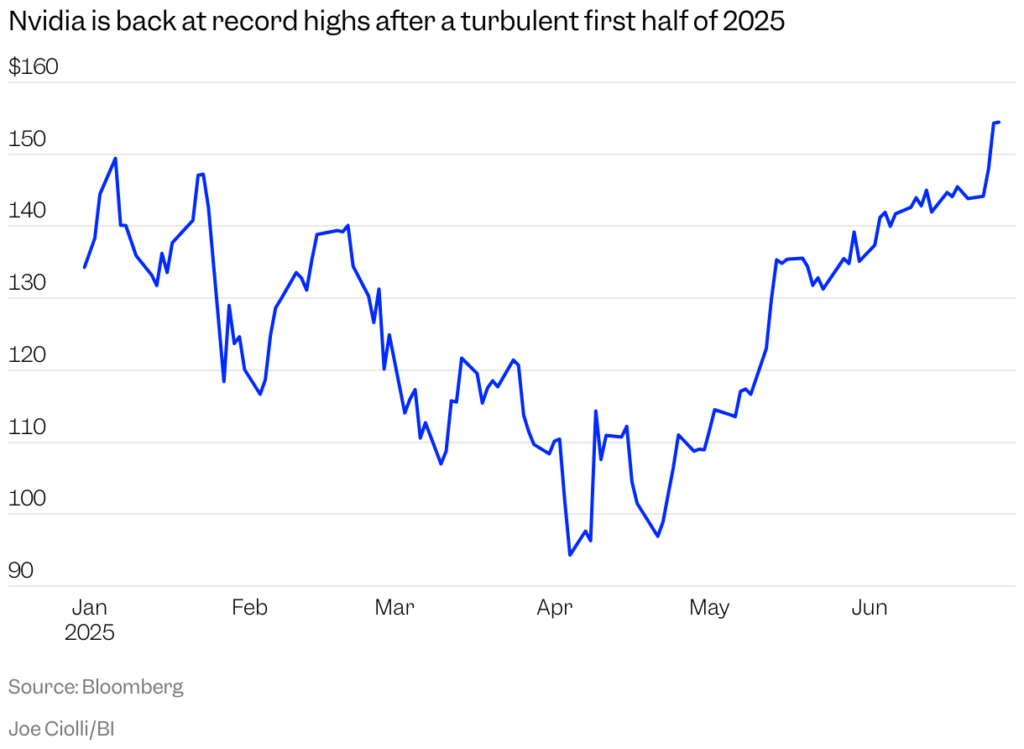
Nvidia shares hit a record high on Wednesday, closing at $154.31 and lifting the chipmaker’s market value to $3.77 trillion. The move allowed the AI titan to reclaim the title of the world’s most valuable company — but one firm thinks the rally isn’t even close to being over. The stock extended its record high

Gold Analysis Today 26/06: Attempts to Halt Losses (Chart)

Attempts to Halt Losses (Chart)

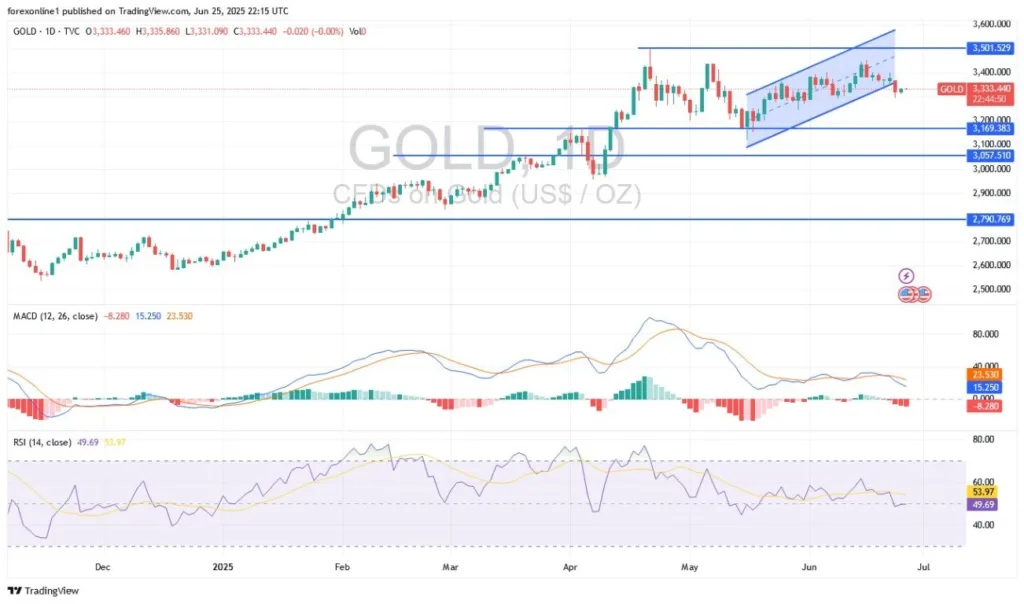
Today’s Gold Analysis Overview: The overall Gold Trend: Neutral, with an upward opportunity still present. Today’s Gold Support Levels: $3310 – $3275 – $3190 per ounce. Today’s Gold Resistance Levels: $3360 – $3400 – $3430 per ounce. Today’s gold trading signals update: Sell Gold from the resistance level of $3375 with a target of $3290

A person throwing dollars.

Can Investing $10,000 in Nvidia Stock Make You a Millionaire?

Nvidia (NVDA 4.26%) stock has lost some of its momentum this year after gaining 1,400% over the past five years. It’s lost some investor confidence for a number of reasons, including fears that new artificial intelligence (AI) models won’t need its powerful chips and regulations that limit what the company can ship to China. But

NZD/USD Analysis Today 26/06: Reversal Up (Chart)

NZD/USD Analysis Today 26/06: Reversal Up (Chart)

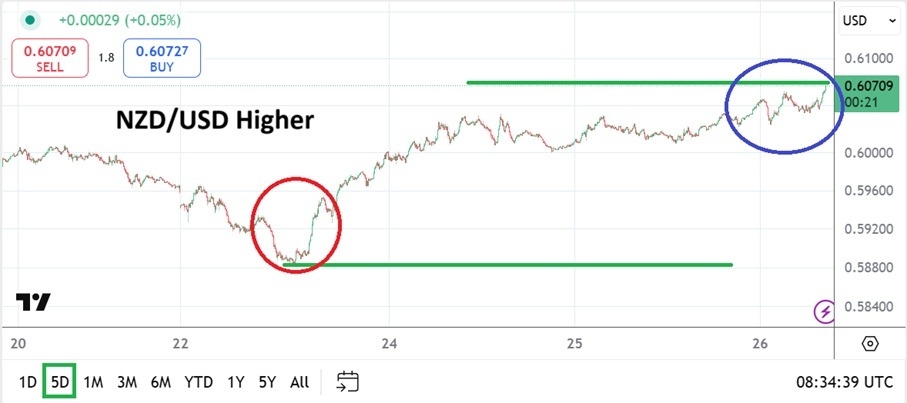
The NZD/USD has recovered it bullish stance and is simmering within the higher elements of its near-term value as financial institutions likely consider higher potential targets amidst USD weakness. The NZD/USD is near the 0.60710 ratio as of this writing. The value of the currency pair is touching its weekly highs as it fluctuates in

Pound Sterling surges, Shell dimisses speculation of BP takeover

Pound Sterling surges, Shell dimisses speculation of BP takeover

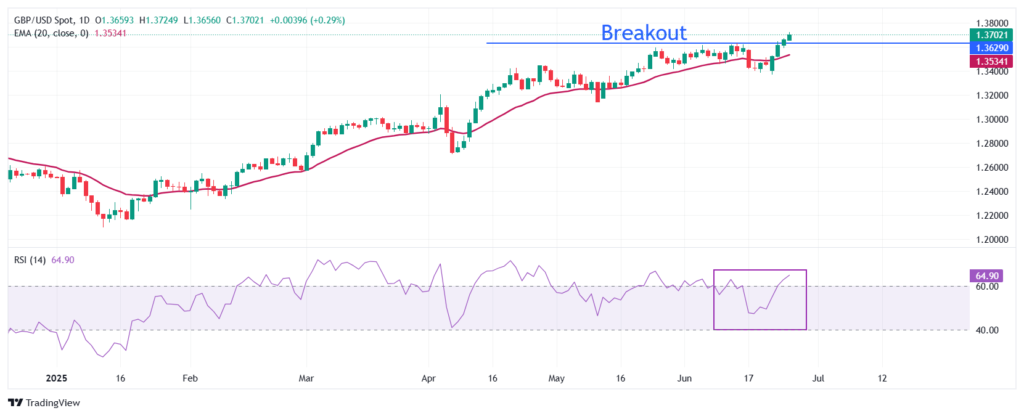
The Pound Sterling climbs to near 1.3765 against the US Dollar on hopes that President Trump will announce Fed Powell’s successor soon. Fed’s Powell warned that the tariff-driven inflation could prove to be persistent. UK employers aim to reduce their labor force to offset the impact of the increase in contributions to social security schemes.

0
Would love your thoughts, please comment.x
()
x