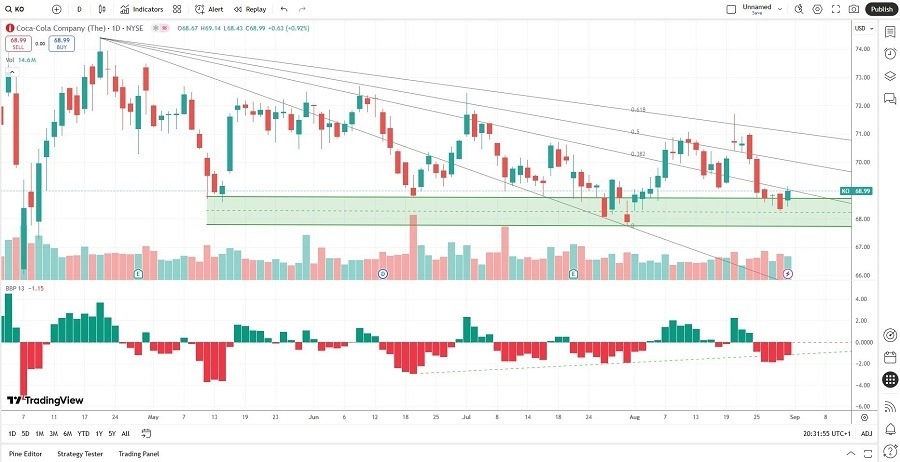
Will Pricing Power Prevail (Chart)

Long Trade Idea

Enter long short position between 67.74 (the lower band of its horizontal resistance zone) and 69.14 (Friday’s intra-day high).

Market Index Analysis

  • The Coca-Cola Company (KO) is a member of the Dow Jones Industrial Average, the S&P 100, and the S&P 500.
  • All three indices trade near records, with mounting concerns about the health of this bull cycle.
  • The Bull Bear Power Indicator of the S&P 500 shows a negative divergence.

Market Sentiment Analysis

Legal drama over President Trump’s tariffs and concerns over the independence of the Federal Reserve will weigh on this week’s sentiment, as investors await Friday’s NFP report. After four months of gains, equity markets enter September, historically the weakest month for bulls. US manufacturing data is due for release today, expected to show contraction and rising prices. Volatility could accelerate amid lower trading volumes as investors rethink portfolios.

Coca-Cola Company Fundamental Analysis

The Coca-Cola Company is one of the world’s largest beverage companies, with a recent push into healthy alternatives and bottled water. It began paying dividends in 1920, and as of 2019, has increased its dividend for 57 consecutive years. It also has a high brand loyalty.

So, why am I bullish on KO after its breakout?

Coca-Cola remains reasonably valued at current levels, while its brand loyalty and pricing power can overcome short-term issues. I like the dividend yield as compensation for taking a risk at the current breakout. Besides an industry-leading return on equity, returns on assets and invested capital are excellent. During times of economic uncertainty, KO offers one of the small luxuries consumers retain despite tighter budgets.

Coca-Cola Company Fundamental Analysis Snapshot

Coca-Cola Company Fundamental Analysis Snapshot

The price-to-earnings (P/E) ratio of 24.46 makes KO an inexpensive stock. By comparison, the P/E ratio for the S&P 500 is 30.01.

The average analyst price target for KO is 78.70, which suggests moderate upside potential with limited downside risks.

Coca-Cola Company Technical Analysis

Today’s KO Signal

Coca-Cola Signal 02/09: Will Pricing Power Prevail (Chart)

Coca-Cola Price Chart

  • The KO D1 chart shows a price action breaking out above its horizontal support zone.
  • It also shows price action challenging its descending 38.2% Fibonacci Retracement Fan levels.
  • The Bull Bear Power Indicator is bearish with an ascending trendline.
  • The bullish trading volume rose during the breakout.
  • KO drifted lower as the S&P 500 inched higher, a bearish trading signal, but bullish factors returned.

My Call on Coca-Cola

I am taking a long position in KO between 67.74 and 69.14. Valuations are reasonable, and I view the brand loyalty, pricing power, and market position as adequate downside protection. The dividend yield adds to the bullish case for KO, and I confidently buy the breakout.

  • KO Entry Level: Between 67.74 and 69.14
  • KO Take Profit: Between 78.70 and 80.17
  • KO Stop Loss: Between 64.65 and 66.05
  • Risk/Reward Ratio: 3.55

Ready to trade our free daily signals? Here is our list of the best brokers for trading worth checking out.

Source link

Visited 1 times, 1 visit(s) today

Related Article

Senators grill Trump’s nominee for Fed post Stephen Miran : NPR

President Trump has nominated the chairman of his Council of Economic Advisers, Stephen Miran, to fill a short-term seat on the Federal Reserve’s governing board. Win McNamee/Getty Images North America hide caption toggle caption Win McNamee/Getty Images North America President Trump’s nominee to fill an open seat on the Federal Reserve board faced tough questions

3 fall prey to forex trade scam, lose around Rs28L

3 fall prey to forex trade scam, lose around Rs28L | Nashik News

Nashik: Three people were allegedly cheated of Rs27.7 lakh on the pretext of earning “fabulous returns” from forex trading, Nashik city cyber police officials said.Inspector Subhash Dhawale said the conmen contacted the victims in June and promised them high returns through foreign exchange investments. “The crooks called the victims separately and explained to them the

Automated Data Signal 04/09: Support Levels Hold? (Chart)

Created on September 04, 2025 Long Trade Idea Enter your long position between $294.59 (the lower band of its horizontal resistance zone) and $300.07 (yesterday’s intra-day high). Market Index Analysis Automated Data Processing (ADP) is a member of the NASDAQ 100 and the S&P 500. Both indices try to hold on near record highs, but

nyse trader red jacket looking at screen

New Stock Market Super Cycle Is Starting, How to Invest: Goldman Sachs

ANGELA WEISS / AFP 2025-09-04T09:35:01Z Share Facebook Email X LinkedIn Reddit Bluesky WhatsApp Copy link lighning bolt icon An icon in the shape of a lightning bolt. Impact Link Save Saved Read in app This story is available exclusively to Business Insider subscribers. Become an Insider and start reading now. Have an account? Log in.

Silver Forecast 04/09: Continues to Stretch (Chart)

Silver Forecast 04/09: Continues to Stretch (Chart)

Created on September 04, 2025 During the trading session on Wednesday, we have seen silver continue to stretch higher, although I’d be the first person to point out that we are running a little hot here, and I think that it is probably only a matter of time before we get some type of pullback.

News Update – Pre-Markets

5 things to know before the stock market opens Thursday

This is CNBC’s Morning Squawk newsletter. Subscribe here to receive future editions in your inbox. Here are five key things investors need to know to start the trading day: 1. Material moves Nearly 99% of S&P 500-listed companies have reported earnings for the quarter, according to FactSet. Several key names released results after the bell yesterday, including

Gold Forecast 04/09: Continues to Rally (Chart)

Gold Forecast 04/09: Continues to Rally (Chart)

Created on September 04, 2025 Gold has been positive during the Wednesday trading session again, as we continue to see plenty of bullish pressure. Ultimately, this is a market that looks very lively, and as it has just recently broken out of a significant consolidation range, one would also assume that momentum should continue to