What Will Follow the Breakdown (Chart)

Short Trade Idea

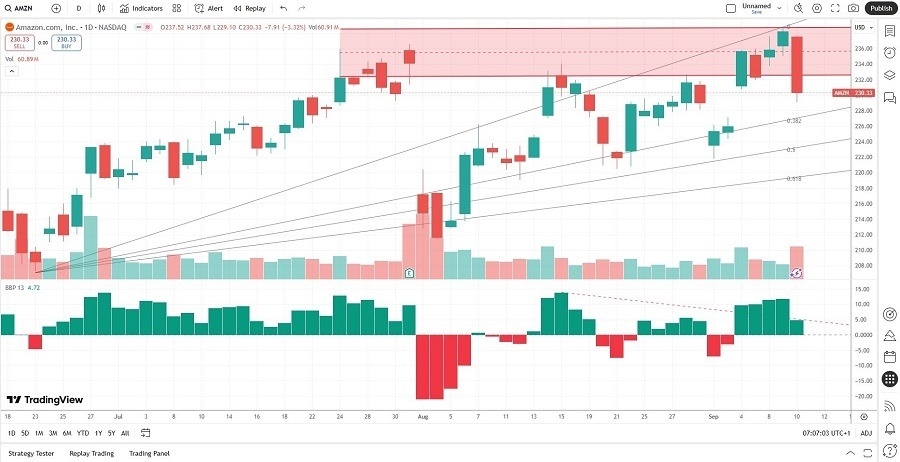
Enter your short position between $229.10 (yesterday’s intra-day low) and $238.85 (the upper band of its horizontal resistance zone).

Market Index Analysis

  • Amazon.com (AMZN) is a member of the NASDAQ 100, the Dow Jones Industrial Average, the S&P 100, and the S&P 500 indices.
  • All four indices are near all-time highs with bearish breakdown patterns emerging.
  • The Bull Bear Power Indicator for the NASDAQ 100 shows a negative divergence and does not confirm the uptrend.

Market Sentiment Analysis

Yesterday’s PPI report showed an unexpected contraction in producer prices for August, but investors will focus on today’s CPI release. Equity markets brushed off the better-than-expected reading yesterday, but Oracle stole the show and kept the AI hype alive with a blockbuster earnings report and future guidance. Today’s CPI report could determine how steeply the US Fed will slash interest rates.

Amazon.com Fundamental Analysis

Amazon.com is one of the Big Five US technology companies and a leader in the global AI race and cloud computing sector. It has excellent profit margins, but its debt remains excessive. AMZN is an industry disruptor but faces stiff competition from China.

So, why am I bearish on AMZN after its momentum shift?

Amazon has launched its Zoox robo-taxi, but it must invest more capital in the sector to become competitive. I like the long-term potential of Amazon, but I also see more downside in the medium term, driven by a capital-intensive business plan that has yet to deliver for investors. AI, cloud computing, and retail competition from China diminish its global sales outlook outside core US allies, and Jeff Bezos continues to offload shares.

Amazon.com Fundamental Analysis Snapshot

Amazon.com Fundamental Analysis Snapshot

The price-to-earning (P/E) ratio of 35.11 makes AMZN an expensive stock. By comparison, the P/E ratio for the NASDAQ 100 is 30.22.

The average analyst price target for AMZN is $263.18. This suggests good upside potential, but medium-term downside risks remain.

Amazon.com Technical Analysis

Today’s AMZN Signal

Amazon Signal 11/09: What Will Follow the Breakdown (Chart)

Amazon.com Price Chart

  • The AMZN D1 chart shows price action breaking down below its horizontal resistance zone.
  • It also shows price action between its ascending 0.0% and 38.2% Fibonacci Retracement Fan levels.
  • The Bull Bear Power Indicator is bullish with a descending trendline.
  • The bearish trading volume during the breakdown more than doubled, confirming the breakdown.
  • AMZN corrected with the NASDAQ 100, a bearish confirmation.

My Call on Amazon.com

I am taking a short position in AMZN between $229.10 and $238.85. AMZN has long-term upside potential, but I am bearish in the medium-term. Competition from China, Bezos’ share sales, and future capital requirements combine for more downside potential.

  • AMZN Entry Level: Between $229.10 and $238.85
  • AMZN Take Profit: Between $197.85 and $207.31
  • AMZN Stop Loss: Between $242.52 and $247.37
  • Risk/Reward Ratio: 2.33

Ready to trade our free daily signals? Here is our list of the best brokers for trading worth reviewing.

Source link

Visited 1 times, 1 visit(s) today

Related Article

Chanlink price chart | Source: Tradingview

Is a Breakout on the Horizon

Created on September 11, 2025 The Chainlink (LINK) token has steadily gained over the past week, and despite resistance capping its upside, buyers remain firmly in control of the broader trend. LINK Price Steady After Recent Gains Chanlink price chart | Source: Tradingview In the last 24 hours, LINK has traded between $23.18 and $23.87,

EUR/USD Analysis 11/09: Trading Awaits US Inflation (Chart)

Trading Awaits US Inflation (Chart)

Created on September 11, 2025 EUR/USD Analysis Summary Today Overall Trend: Cautiously neutral. Support Levels: 1.1660 – 1.1600 – 1.1540 Resistance Levels: 1.1750 – 1.1810 – 1.1880 EUR/USD Trading Signals: Buy: Buy EUR/USD from the support level of 1.1580, with a target of 1.1800 and a stop-loss at 1.1500. Sell: Sell EUR/USD from the resistance

Markets mostly up as US producer price data stokes rate cut bets

Data showig a fall in producer prices last month came ahead of key consumer figures due Thursday and boosted rate cut hopes (Frederic J. BROWN) Asian equities mostly rose Thursday as investors built on this week’s rally after US data ramped up expectations for a string of interest rate cuts. Markets have enjoyed a healthy

Newmont to Delist from TSX, Maintains NYSE and ASX Listings

09/10/2025 – 05:30 PM Newmont to Maintain Listings on the NYSE, ASX and PNGX Exchanges DENVER–(BUSINESS WIRE)– Newmont Corporation (NYSE: NEM, TSX: NGT, ASX: NEM, PNGX: NEM) (“Newmont” or the “Company”) announces that it has

When you look at credit quality numbers, Klarna has impressive underwriting standards: Jim Cramer

Here’s why Jim Cramer thinks IPO Klarna is still a buy at these levels

CNBC’s Jim Cramer explained why he thinks newly-minted IPO Klarna is a buy even after shares climbed during its first trading session. “While Klarna roared right out of the gate, the stock hasn’t gone to an insane valuation yet. I think the numbers look good, so I think it can be bought at these levels,”

Klarna's IPO: Here's Who's Getting Rich

Klarna’s IPO: Here’s Who’s Getting Rich

Two decades after its founding, Klarna has gone public, and its investors are finally seeing a windfall. The Swedish “buy now, pay later” company listed on the New York Stock Exchange on Wednesday. Its stock popped 30% on its debut, jumping above its $40-per-share IPO price to $52 a share. That IPO price gave Klarna

Robinhood Aims Social Platform at Reddit’s WallStreetBets

(Bloomberg) — Soon, Robinhood Markets Inc.’s retail traders won’t have to leave the platform to brag about their positions or post taunting memes celebrating their investment victories. The online brokerage is breaking into social media. The move is a return of sorts to the firm’s origins. Before starting their trading platform, Robinhood founders Vlad Tenev