What Will Follow the Breakdown (Chart)

Short Trade Idea

Enter your short position between $229.10 (yesterday’s intra-day low) and $238.85 (the upper band of its horizontal resistance zone).

Market Index Analysis

  • Amazon.com (AMZN) is a member of the NASDAQ 100, the Dow Jones Industrial Average, the S&P 100, and the S&P 500 indices.
  • All four indices are near all-time highs with bearish breakdown patterns emerging.
  • The Bull Bear Power Indicator for the NASDAQ 100 shows a negative divergence and does not confirm the uptrend.

Market Sentiment Analysis

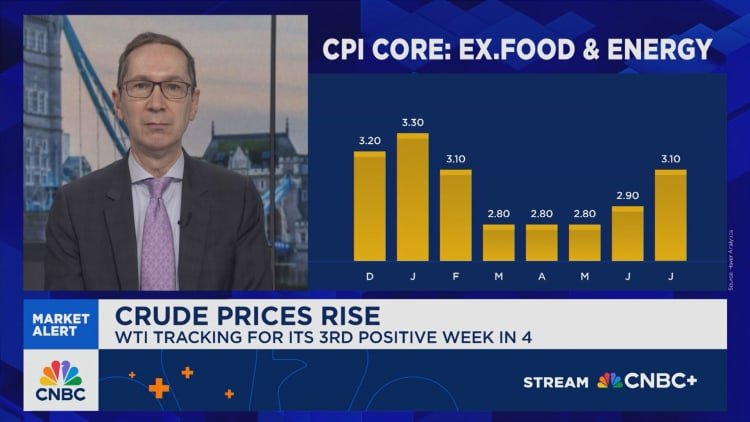
Yesterday’s PPI report showed an unexpected contraction in producer prices for August, but investors will focus on today’s CPI release. Equity markets brushed off the better-than-expected reading yesterday, but Oracle stole the show and kept the AI hype alive with a blockbuster earnings report and future guidance. Today’s CPI report could determine how steeply the US Fed will slash interest rates.

Amazon.com Fundamental Analysis

Amazon.com is one of the Big Five US technology companies and a leader in the global AI race and cloud computing sector. It has excellent profit margins, but its debt remains excessive. AMZN is an industry disruptor but faces stiff competition from China.

So, why am I bearish on AMZN after its momentum shift?

Amazon has launched its Zoox robo-taxi, but it must invest more capital in the sector to become competitive. I like the long-term potential of Amazon, but I also see more downside in the medium term, driven by a capital-intensive business plan that has yet to deliver for investors. AI, cloud computing, and retail competition from China diminish its global sales outlook outside core US allies, and Jeff Bezos continues to offload shares.

Amazon.com Fundamental Analysis Snapshot

Amazon.com Fundamental Analysis Snapshot

The price-to-earning (P/E) ratio of 35.11 makes AMZN an expensive stock. By comparison, the P/E ratio for the NASDAQ 100 is 30.22.

The average analyst price target for AMZN is $263.18. This suggests good upside potential, but medium-term downside risks remain.

Amazon.com Technical Analysis

Today’s AMZN Signal

Amazon Signal 11/09: What Will Follow the Breakdown (Chart)

Amazon.com Price Chart

  • The AMZN D1 chart shows price action breaking down below its horizontal resistance zone.
  • It also shows price action between its ascending 0.0% and 38.2% Fibonacci Retracement Fan levels.
  • The Bull Bear Power Indicator is bullish with a descending trendline.
  • The bearish trading volume during the breakdown more than doubled, confirming the breakdown.
  • AMZN corrected with the NASDAQ 100, a bearish confirmation.

My Call on Amazon.com

I am taking a short position in AMZN between $229.10 and $238.85. AMZN has long-term upside potential, but I am bearish in the medium-term. Competition from China, Bezos’ share sales, and future capital requirements combine for more downside potential.

  • AMZN Entry Level: Between $229.10 and $238.85
  • AMZN Take Profit: Between $197.85 and $207.31
  • AMZN Stop Loss: Between $242.52 and $247.37
  • Risk/Reward Ratio: 2.33

Ready to trade our free daily signals? Here is our list of the best brokers for trading worth reviewing.

Source link

Visited 1 times, 1 visit(s) today

Related Article

Morris: The Fed has to balance inflation pressures with a weak labor market

Here’s the inflation breakdown for August 2025 — in one chart

Shoppers browse shoes at a store in Los Angeles on Aug. 28, 2025. Bloomberg | Bloomberg | Getty Images Inflation picked up in August amid higher prices for staples like food and electricity, while tariffs put upward pressure on prices for physical goods like clothing and household furniture, economists said. The consumer price index, a

NZD/USD Analysis 11/09: Near-Term Incremental (Chart)

NZD/USD Analysis 11/09: Near-Term Incremental (Chart)

Created on September 11, 2025 After stumbling to value that challenged the 0.58000 level in late August, the NZD/USD has been able to produce a hard fought incremental climb higher and is near the 0.59300 ratio as of this writing. The NZD/USD has found buyers in the past two weeks, but day traders have had

Opendoor stock soars 60% after company names new CEO

OpenDoor is disrupting the real estate market with its new model. It buys homes and sells them on its platform. Opendoor Opendoor stock rocketed 60% higher on Thursday after the retail favorite named Shopify executive Kaz Nejatian as CEO and co-founder Keith Rabois as chairman. The meme stock hit a 52-week high and continued a

USD/RUB Analysis 11/09: Increase in Tensions (Chart)

USD/RUB Analysis 11/09: Increase in Tensions (Chart)

Created on September 11, 2025 The USD/RUB has gone from a rather tranquil value of 80.0000 in the past few days to above 85.0000 as of yesterday, this as it appears tensions are building and the prospects of increased conflict escalates. Since the first week of May this year the USD/RUB has seen trading within

Gold Analysis 11/09: Gold Prices Stable (Chart)

Gold Analysis 11/09: Gold Prices Stable (Chart)

Created on September 11, 2025 Today’s Gold Analysis Overview: Overall Gold Trend: Strongly bullish. Support Levels: $3610 – $3570 – $3500 per ounce. Resistance Levels: $3670 – $3690 – $3730 per ounce. Today’s Gold Trading Signals: Sell: Sell gold from the $3685 resistance level, with a target of $3540 and a stop-loss at $3710. Buy:

Inflation climbs in August as grocery and gas prices jump : NPR

Grocery prices jumped 0.6% in August, fueling a sharper-than-expected jump in inflation last month. Frederic J. Brown/AFP hide caption toggle caption Frederic J. Brown/AFP Inflation inched higher last month as Americans closed out the summer paying more for both groceries and gasoline. Consumer prices in August were up 2.9% from a year ago, according to

Why Is Opendoor (OPEN) Stock Soaring Today

This article first appeared on GuruFocus. Sep 11 – Opendoor (NASDAQ:OPEN) shares jump about 30% in early Thursday trading after the company names Kaz Nejatian as CEO and brings co-founder Keith Rabois back as chairman. The move follows last month’s resignation of Carrie Wheeler amid investor pressure and a period of intense retail interest that

Chanlink price chart | Source: Tradingview

Is a Breakout on the Horizon

Created on September 11, 2025 The Chainlink (LINK) token has steadily gained over the past week, and despite resistance capping its upside, buyers remain firmly in control of the broader trend. LINK Price Steady After Recent Gains Chanlink price chart | Source: Tradingview In the last 24 hours, LINK has traded between $23.18 and $23.87,