Posted by Colin Lambert. Last updated: June 9, 2025
Although markets settled somewhat in May, the heightened volatility, with the associated nervousness, means that market impact at the month-end London 4pm FX Fix remains at high levels relative to recent history, with May exhibiting the second highest (after April) costs since February 24.
Investors whose funds use the 20-minute Siren FX methodology at the May month-end, would have benefited from $592 per million savings, compared to those using the five-minute WMR Benchmark Fix at the same time. This is above the 2024 average of $319 per million and largely in line with the 40-month average (since The Full FX started tracking data) of $577 per million.
Although that number should be a concern to investors, perhaps more worrying is the size of the gulf in EUR/USD, with the longer Siren window providing $732 per million in potential savings for the world’s busiest currency pair. This is the highest since December 2023 and the second highest since November 2022. It is also more than three-times the 2024 average, and significantly over the 49-month average of $495 per million.
In contrast, USD/JPY had its lowest market impact since September 2023 at “just” $97 per million, notably below its 49-month average of $581 per million and the 2024 average of $489 per million. Cable was also below its longer-term average, but above the 2024 mean, while USD/CAD, USD/CHF, AUD/USD and NZD/USD all provided larger-than-average savings.
While these savings are significant, the reality is that they were likely to have been higher than published here. As noted below, the WM rate is calculated by Siren FX using its proxy WM calculation method, but this still uses higher frequency data that WM, meaning there are, occasionally, meaningful differences.
This was the case this month in terms of EUR/USD. Cable, and USD/CHF , which were all actually higher than the proxy fix according to sources with whom The Full FX checked the data, while in USD/JPY, the actual saving would have been slightly lower using the actual WM rate. The differences were, according to the sources, 1.1 pips in EUR, 2.3 pips in Cable and 1.6 pips in the Swiss, while the yen difference was 0.8 pips. AUD, CAD and NZD were either exactly on the Siren proxy or close in the case of the latter.
To provide more context, the table below also presents projected dollars per million savings across a portfolio of different pairs using a correlation with the Fix calculation, depending upon how much flow was in the direction of the market, or “with the wind”. The rates used for the WM column are calculated using Siren’s proxy five-minute window, which utilises data from New Change FX, however The Full FX endeavours to check that they are a reasonable reflection of those published by the WM.
| CCY Pair | WMR 4pm Fix* | Siren Fix | 100%** | 80% | 70% | 60% |
| EUR/USD | 1.13514 | 1.13431 | $732 | $439 | $293 | $146 |
| USD/JPY | 144.287 | 144.301 | $97 | $58 | $39 | $19 |
| GBP/USD | 1.34832 | 1.3479 | $312 | $187 | $125 | $62 |
| AUD/USD | 0.64352 | 0.64313 | $606 | $364 | $243 | $121 |
| USD/CAD | 1.37495 | 1.37586 | $661 | $397 | $265 | $132 |
| NZD/USD | 0.59698 | 0.59659 | $654 | $392 | $261 | $131 |
| USD/CHF | 0.82171 | 0.82235 | $778 | $467 | $311 | $156 |
| USD/NOK | 10.21603 | 10.22351 | $732 | $439 | $293 | $146 |
| USD/SEK | 9.60534 | 9.61261 | 756 | $454 | $303 | $151 |
| Average | $592 | $355 | $237 | $118 |
*According to Siren FX calculation using NewChange FX data
** Savings are in dollars per million by percentage of correlation to the Fix flow. Blue cells signify a projected saving using Siren, Red cells a saving using WMR
It is perhaps not insignificant that there was a degree of confusion over month-end flows leading into the 4pm Fix on May 30, based on equity and bond performance, several banks signalled expectations of dollar buying, however the models signalling dollar selling, especially versus G10. This was especially the case in USD/JPY, which saw a strong sell off by some 45 points, followed by a 90-point rally leading into the WM window.
EUR/USD in contrast, with one small selling spurt, saw steady EUR buying for some 10 minutes ahead of the WM window opening. The pair entered the five-minute window some 20 points higher, before rising another 10 pips ahead of two-way trading setting in for the second half of the window.
The pair traded sideways exiting the WM window, highlighting that the demand for euros in that period far outweighed the market’s capacity, thus providing an example of why critics of the shorter mechanism call for a longer calculation period.

Source: Siren FX
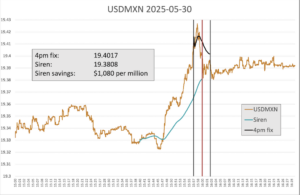
Every month, The Full FX is selecting an emerging market currency pair at random, and before the data is available, to broaden the analysis – this month the selected pair is USD/MXN. Data is again provided by Siren FX according to the same guidelines in place for the regularly reported currency pairs.
Source: Siren FX
There was pronounced dollar buying ahead of the WM window, driving the pair more than nine big figures higher in the 10 minutes up to the opening of the calculation window. This sharp move continued in the early stages of the WM window, before an equally sharp reversal after about one minute. This could be the result of a dollar sell order hitting the market, but is more likely to have been selling by speculators, tipped off by the hedging activity in the lead up.
The potential saving from using the 20-minute methodology was $1,080 per million, down from that in April in USD/ZAR, but well above the 2024 average of $774 per million. For the 48 months that The Full FX has been publishing the data, the average emerging market pair saving is just under $1,060 per million.

![The display board at the Hana Bank dealing room in Jung District, central Seoul, shows the Kospi index and other indicators on June 9. [YONHAP]](https://koala-by.com/wp-content/uploads/2025/06/c2d16ac7-e806-4d27-be52-f60ba0825392.jpg)