Today’s Gold Analysis Overview:
- Overall Gold Trend: Strongly bullish.
- Daily Support Levels: $3560 – $3510 – $3460 per ounce.
- Daily Resistance Levels: $3630 – $3670 – $3710 per ounce.
Today’s Gold Trading Signals:
- Buy: Buy gold from the $3500 support level with a target of $3620 and a stop-loss at $3460.
- Sell: Sell gold from the $3635 resistance level with a target of $3540 and a stop-loss at $3660.
Technical Analysis of Gold Price (XAU/USD) Today:
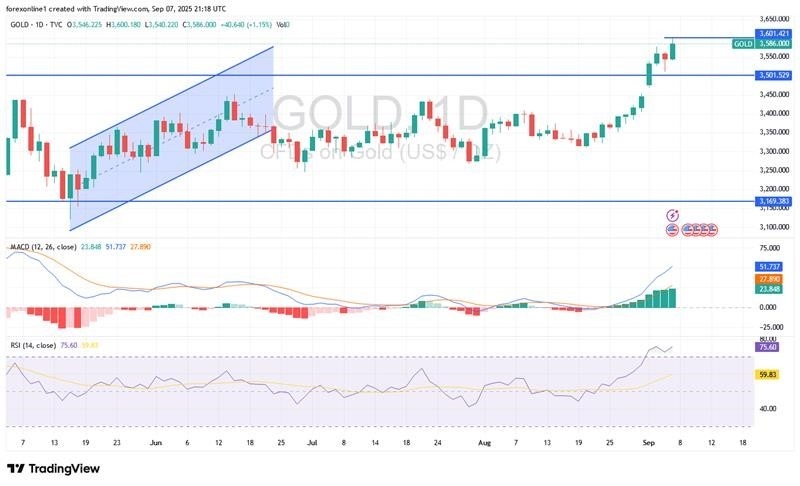
As previously predicted, gold investors may ignore the strong overbought signals from technical indicators and continue to push real-time gold prices to new historical highs. This has happened, and according to gold trading platforms, the gold price index has risen to the $3600 per ounce resistance level, the highest ever in the history of the gold trading market. In addition to growing geopolitical and trade tensions supporting gold’s strength, the U.S. currency has come under pressure from disappointing U.S. jobs report figures. This has increased financial markets’ expectations for a U.S. interest rate cut later this month.
The bullish scenario for gold prices remains the strongest, but as we can see from the performance on the daily timeframe chart, the 14-day Relative Strength Index (RSI) is around 75, breaking through the strong overbought line. The same applies to the MACD indicator, which closed at 12.26. Also, the continued strength of the price signals a new record high unless gold investors slow down their buying pace and begin profit-taking to establish new buying bases.
We expect gold market gains to subside pending a response to the announcement of US inflation figures this week and the announcement of the European Central Bank’s monetary policy decisions.
Trading Advice:
Traders are advised to calm their sentiment toward gold. The market may be exposed to profit-taking at any time, and it is best to wait for prices to drop before buying.
Will gold prices decline in the coming days?
According to gold analysts’ views and forecasts, the widely disappointing U.S. jobs data gave the Federal Reserve a green light to cut U.S. interest rates later this month. Consequently, this has pushed the gold index out of its consolidation phase and back to record levels. Overall, the weak economic data provided new support for gold, which briefly touched $3,600 per ounce before last weekend. Moreover, the spot gold price was last traded at $3,590.70 per ounce, up more than 1% on the day. Furthermore, this sudden surge in the yellow metal pushed prices up by more than 4% last week.
Keep in mind that the gold market is witnessing its best gains since mid-May when prices were setting their months-long trading range around $3,300 per ounce. Although the gold trading market is still strongly supported as markets await the Fed’s interest rate cut beyond September, many analysts are questioning how much more room there is for the market to rise. Long-term sentiment toward gold remains very positive; however, some analysts believe the market is technically overbought.
Some commodity market experts believe that last Friday’s massive momentum for gold was like a speeding train heading toward the psychological level of $3600. With fundamental factors favoring gold buyers, there may be more upside with the first checkpoint at $3600. However, technical indicators show that prices are significantly overbought with an imminent correction possible. If prices drop below $3570, those selling may target $3540, and possibly $3500, before resuming the climb.
However, some experts believe that, given gold’s current momentum, this rally appears likely to take the gold index to $3,800 per ounce.
Ready to trade our Gold forecast? We’ve shortlisted the most trusted Gold brokers in the industry for you.

