I wrote on 22nd June that the best trades for the week would be:
- Long of the EUR/USD currency pair. This ended the week higher by 1.69%.
- Long of Gold in USD terms. This ended the week lower by 3.24%.
- Long of Silver in USD terms following a daily (New York) close above $37.13. This did not set up.
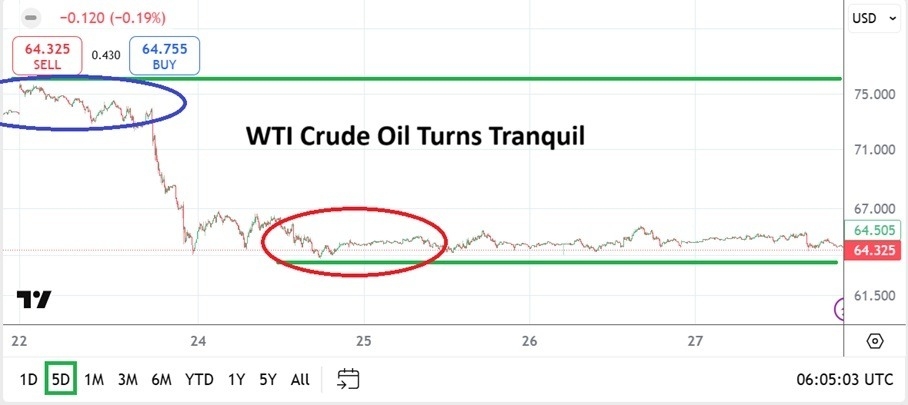
- Long of WTI Crude Oil if there is a daily (New York) close above $80.43. This did not set up.
The overall loss of 1.55% equals a loss of 0.52% per asset.
The news this week has been dominated by the clear Israeli / American victory over Iran, which ended with a US ceasefire last Tuesday morning. Both Israel and the Trump administration have been quite belligerent, threatening to resume bombing if Iran acts to rebuild its nuclear and ballistic missile capabilities. The scale of the victory will certainly tilt the dynamics of the Middle East towards Israel and the USA, with the Trump administration hinting that further countries, possibly even including Syria, will shortly be joining the Abraham accords, i.e. making a formal peace with Israel.
The aftermath of the war has seen risk assets, especially in the USA, increase in value, with major US stock market indices like the NASDAQ 100 and the S&P 500 breaking out to new all-time high prices, which is usually a very bullish sign.
This bullish environment is interesting as it contradicts some economic data we got this week and what the Federal Reserve is saying, not to mention the 9th July Trump tariff deadline which is just around the corner.
- Jerome Powell, Chair of the Fed, has now led investors to expect three further rate cuts this year of 0.25% each, up from two.
- Final GDP data for the USA came in notably worse than expected, suggesting a recession might even be possible.
Turning to the 9th July tariff deadline, the USA has concluded only two trade deals, meaning that if more deals are not inked over the next 10 days, the US will impose much higher tariffs on many countries. However, the White House has embraced the concept that the deadline could be pushed off again by a few months, so this is another reason the market has not yet got notably bothered by this.
I think the risk on / long stocks / short USD dynamic is likely to continue all week.
Last week’s most important data releases were:
- Fed Chair Jerome Powell Testifies Before US Congress – took a slight hawkish tilt, leading markets to now expected three rates cuts of 0.25% each by the end of 2025.
- US Core PCE Price Index – this came in a fraction higher than expected, at a month-on-month increase of 0.2% when only 0.1% was expected.
- US Final GDP – this was considerably worse than expected, showing a quarterly decline of 0.5% when a decline of only 0.2% was expected.
- Canadian CPI (inflation) – this was higher than expected, up by 0.6% month-on-month while an increase of only 0.5% was expected.
- Australian CPI (inflation) – this was lower than expected, with the annualized rate falling to 2.1% when a rate of 2.3% was expected. This is the lowest rate of Australian inflation seen in years.
- Canadian GDP – this showed a decline of 0.1% month-on-month, while no change was expected.
- US, German, UK, French Services & Manufacturing PMI – in France, the data was below expectations; elsewhere, mostly above.
- US Unemployment Claims – this was approximately as expected.
The coming week has a lighter program of high-impact data releases, with the most notable event likely to US Non-Farm Payrolls and Average Hourly Earnings which will be released on Thursday.
This week’s important data points, in order of likely importance, are:
- US Average Hourly Earnings
- US Non-Farm Employment Change
- US JOLTS Job Openings
- US Unemployment Rate
- US ISM Services PMI
- US ISM Manufacturing PMI
- Swiss CPI (inflation)
- Chinese Manufacturing PMI
The most impactful events on the Forex market will likely be the top three items.

For the month of July 2025, I forecast that the EUR/USD currency pair will increase in value.
For the month of June 2025, I forecasted that the EUR/USD currency pair would increase in vale. The performance of this forecast so far is:

As there were no unusually large price movements in Forex currency crosses over the past week, I make no weekly forecast.
The Swiss Franc was the strongest major currency last week, while the US Dollar was the weakest. Volatility increased markedly last week, with 41% of the most important Forex currency pairs and crosses changing in value by more than 1%. Next week’s volatility is likely to decline.
You can trade these forecasts in a real or demo Forex brokerage account.

Last week, the US Dollar Index printed a very bearish, outside, engulfing candlestick which made the lowest weekly close since February 2022. This bearish move saw the price break and get established below the key support level at 97.54. There is clearly a strong and continuing long-term bearish trend in the US Dollar.
The weakness in the greenback stands out even more when you consider that last week saw the Federal Reserve talk up the pace of rate hikes over the remainder of 2025, which should have strengthened the Dollar.
It makes sense to be trading in line with the long-term trend which will be short of the greenback, especially as risk appetite, particularly for American technology stocks, has returned in a big way following the conclusion of the Iran war which seems to have seriously weakened the regime’s military and nuclear capabilities.

The NASDAQ 100 Index rose strongly last week, closing very near the high of its range at a new all-time high price. These are very bullish signs, about as bullish as it is possible to get.
The NASDAQ 100 Index has an excellent track record of averaging an annual return well above 10% since it was founded in 1985. Furthermore, when it breaks out to a new all-time high, it usually does even better than that. These are powerful reasons to invest here, if you believe that the future will be like the past.
There are good sentimental reasons for bullishness in stock markets, especially in the USA, although we see economic contraction and higher than expected interest rates there. Yet the buoyant mood continues, lifted by the overwhelming US / Israeli victory in the Iran war, which seems to have taken the prospect of a nuclear Iran off the table for a few years at least, as well as opening the door perhaps to more peace deals with Israel, and possibly even the end of the war in Gaza.
I think there are excellent reasons to be long of this Index.

NVIDIA is the major component of the NASDAQ 100 Index at over 13% of the index by weighting. It is a leading tech company and is heavily traded and very liquid. Right now, it seems to be leading the NASDAQ 100 Index higher, after rising strongly last week and closing at a new all-time high price very close to the top of its weekly range.
The NASDAQ 100 Index has an excellent track record of averaging an annual return well above 10% since it was founded in 1985. Furthermore, when it breaks out to a new all-time high, it usually does even better than that. The best news of all is that in these conditions which are currently being met, being long of the top stocks in the Index which are showing the strongest bullish momentum, tends to produce an even better performance.
These are all excellent reasons for being long of NVIDIA over the coming week but be sure to use a trailing stop of not more than 3 times the long-term ATR volatility.

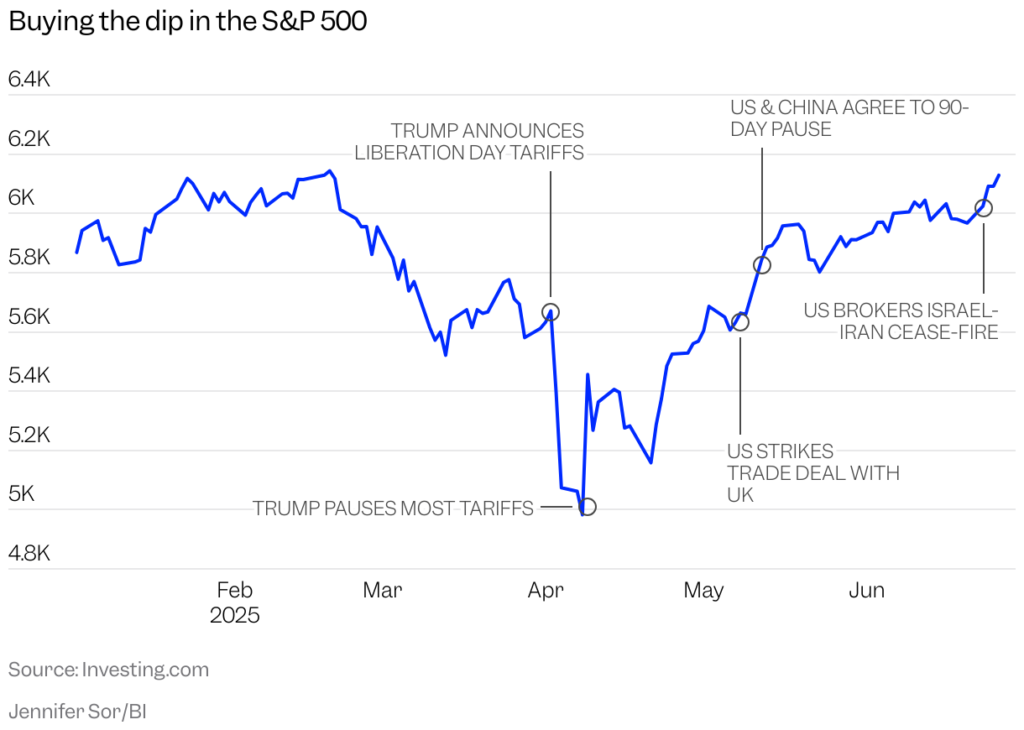
The S&P 500 Index rose strongly last week, closing very near the high of its range at a new all-time high price. These are very bullish signs, about as bullish as it is possible to get.
The S&P 500 Index has an excellent track record of averaging an annual return of about 7%. Furthermore, when it breaks out to a new all-time high, it usually does even better than that. These are powerful reasons to invest here, if you believe that the future will be like the past.
Looking at the price chart below, we can see the tariff shock of a few weeks ago sent the price plummeting hard, but since then we have seen an extremely strong comeback reminiscent of the coronavirus crash and rebound of 2020. If this is a lesson to follow, we might expect continuing strong gains in US stock markets.
I think there are excellent reasons to be long of this Index.

The USD/CHF currency pair is at the heart of the Forex market right now, with the Swiss Franc the strongest gainer last week of all the major currencies, while the US Dollar was the weakest major currency.
This pair printed a large bearish candlestick, reaching and closing at a long-term 13 year low near the bottom of its range below the big round number at $0.8000. These are very bearish signs, but it is important to remember that this currency pair typically does not trend reliably. The Swiss Franc is strongly positively correlated with the Euro, so trading EUR/USD long will probably be a better bet for trend or momentum traders.

The EUR/USD currency pair is within a valid long-term bullish trend, and this currency pair has an excellent record of respecting such a trend.
The price rose strongly last week to close near the top of its range at a new 3.5 year high. These are very bullish signs.
The Euro is strong and one of the primary beneficiaries of the continuing weakness in the US Dollar.
It is usually best to enter trend trades in this currency pair on a retracement (pull back), but I think the momentum has been so strong it is a good idea just to enter right away when markets open and spreads have declined to an acceptable level.

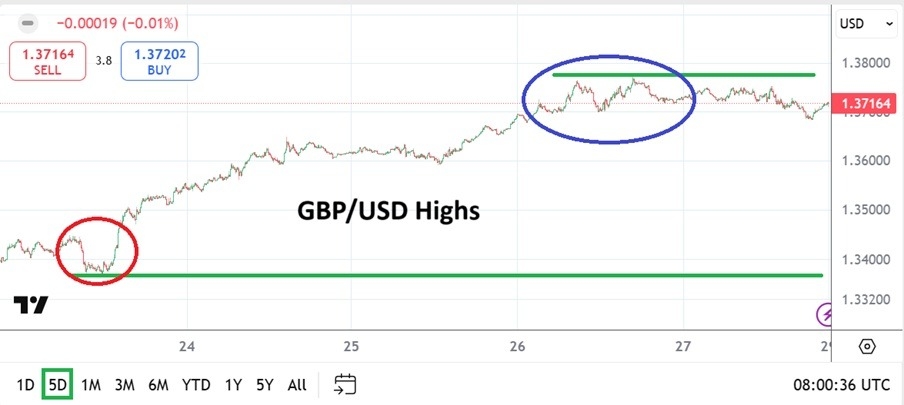
The GBP/USD currency pair rose quite strongly last week, printing a large outside engulfing candlestick, mirroring the price action of the EUR/USD which it is usually very positively correlated to. The price broke out to a new 3.5 year high but rejected the resistance level at $1.3769, almost to the pip, and ended the week a bit further off its high than the EUR/USD did.
This suggests that it might be better to trade the EUR/USD instead of trading this pair long over the coming week.

Silver in US Dollar terms again printed another indecisive or possibly indecisive bearish near-doji candlestick, suggesting that although Silver is holding up much better than Gold, it is also quite likely to take a strongly bearish turn.
It is true that Platinum and Palladium have recently reached new long-term highs, so there is bullish activity in precious metals as an asset class.
Despite the bearish price action, as the retracement so far has been extremely shallow, I would still look to enter a long trade following a bullish breakout to a new multi-month high which also sees a New York daily close at a long-term high price, say above $37.25 per ounce.

I see the best trades this week as:
- Long of the EUR/USD currency pair.
- Long of the NASDAQ 100 Index.
- Long of NVIDIA.
- Long of Silver in USD terms following a daily (New York) close above $37.25.
Ready to trade our weekly Forex forecast? Check out our list of the top 10 Forex brokers in the world.