I wrote on 1st June that the best trades for the week would be:
- Long of Bitcoin following a daily (New York) close above $111,743. This did not set up.
- Long of the GBP/USD currency pair following a daily (New York) close above $1.3513. This set up on Monday, but Friday saw the price close lower by 0.13%.
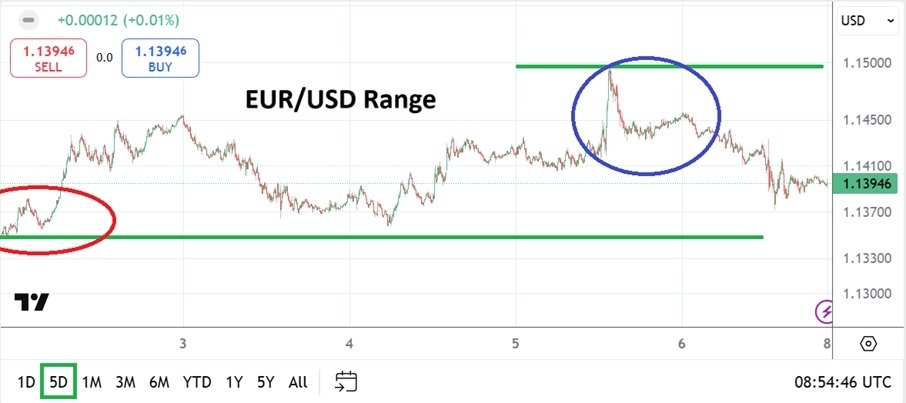
- Long of the EUR/USD currency pair following a daily (New York) close above $1.3558. This did not set up.
- Long of the S&P 500 Index pair following a daily (New York) close above 6,142. This did not set up.
The overall loss of 0.13% equals a loss of 0.03% per asset.
Last week’s market was a bit more active, with stock markets rising, especially in Germany, where the DAX reached a new all-time high before falling a little at the end of the week, when the US Dollar got a boost from higher-than-expect NFP jobs data and average hourly earnings, which pushed back expectations of rate cuts a bit.
There is still no news about tariff deals, and the supposedly final deadline for Trump’s tariffs to be either negotiated away or imposed is less than one month away, on 9th July.
The European Central Bank cut its interest rate by 0.25%, as was widely expected. The following press conference saw the Euro and Pound soar for an hour or two before falling back and giving up much of their earlier gains, so there seems to have been nothing from the ECB that caused a sustained change. Although the GBP/USD and EUR/USD price charts look quite bullish, the US Dollar Index chart is suggestive of a major bullish reversal (see below) so some caution here might be wise.
The Bank of Canada left rates unchanged, so there was no surprise there, and the Loonie barely reacted to this meeting.
Last week’s most important data releases were:
- US Non-Farm Payrolls and Average Hourly Earnings – NFP came in a bit above estimates, at 139k new jobs, while Average Hourly Earnings increased by 0.4% month-on-month, and that latter number is a high, key metric which the Fed watches.
- European Central Bank Policy Meeting
- US ISM Services PMI – this was considerably worse than expected, a full three points below the estimate.
- US JOLTS Job Openings – considerably better than expected at 7.39 million, when only 7.11 million new jobs were expected.
- Bank of Canada Policy Meeting
- Swiss CPI (inflation) – as expected, with a month-on-month increase of 0.1%.
- Australia GDP – notably lower than expected, with quarterly economic growth standing at only 0.2% when a rate of 0.4% was anticipated.
The coming week has what will probably turn out to be a more decisive schedule of high-impact data releases.
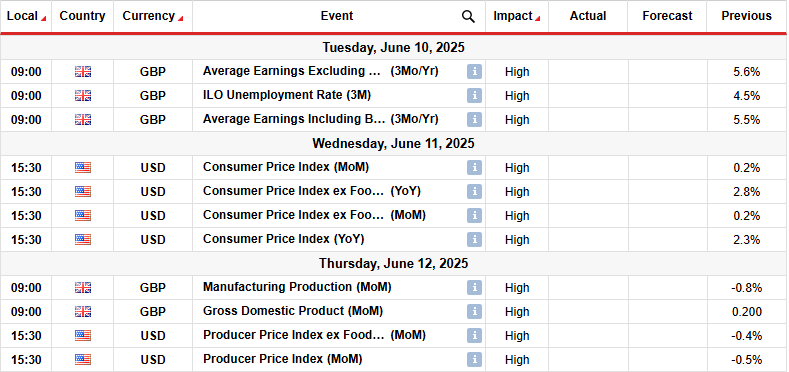
This week’s important data points, in order of likely importance, are:
- US CPI (inflation)
- US PPI
- US Preliminary UoM Consumer Sentiment
- UK GDP
- US Unemployment Claims
- UK Claimant Count Change
The most impactful events on the Forex market will likely be the top two items, or maybe the top three.
How US inflation and PPI are progressing will likely be important for stock markets, the perception of tariffs to some extent, and for the US Dollar.
Monday is a public holiday in Australia, Germany, Switzerland, and France.

For the month of June 2025, I forecasted that the EUR/USD currency pair will increase in value. The performance of this forecast so far is:
")
As there were no unusually large price movements in Forex currency crosses over the past week, I make no weekly forecast.
The Australian Dollar was the strongest major currency last week, while the Japanese Yen was the weakest. However directional movement was relatively low. Volatility increased last week, with 15% of the most important Forex currency pairs and crosses changing in value by more than 1%. Next week’s volatility is likely to be higher as we will get crucial US CPI and PPI data.
You can trade these forecasts in a real or demo Forex brokerage account.

Last week, the US Dollar Index printed a bullish pin bar whose lower wick rejected a level very close to the key support below at 97.67, printing what might be a bullish double bottom chart pattern. These bullish factors contradict the long-term bearish trend and the fact that the price remains close to the multi-year low made a few weeks ago.
I think it makes sense to be trading in line with the long-term trend which will be short of the greenback, but only after the price has either got established below the support level at 97.67, or alternatively if the price is rejecting a key resistance level above, say at 101.39 which probably will not be reached over the coming week anyway.

The GBP/USD currency pair reached a new three-year high last Thursday, above $1.3600, before falling back to end the week lower. This may represent a bearish 2B failed breakout, or just a loss of bullish momentum. It is also worth noting, again on the bearish side, that the increase earlier in the week was not much. Another bearish factor is the bearish pin bar on Thursday followed by strongly engulfing bearish candle on Friday.
On the other hand, looking to the left we can see that this currency pair has been in a firmly bullish long-term trend for all of 2025. There are fundamental reasons for this: the long-term strength in the British Pound (boosted by higher than expected inflation producing an outlook of relatively high interest rates) coupled with the long-term bearish trend in the US Dollar is likely to produce more long-term bullish breakouts here, which might be successfully traded with a relatively tight trailing stop – about 1 ATR daily of a long-term value tends to work best with this currency pair.
There are reasons for bulls to be cautious, but if we get a daily (New York) close above $1.3616 (the multi-year high) without a significant upper wick, I will enter a new long trade.

Silver in US Dollar terms reached a new thirteen-year high last week, above $36 per ounce, before falling a bit on Friday. However, it gave up only about $0.30 of its gains which is little. The long-term high, the holding of gains, and the strong bullish momentum are all powerful bullish factors worth respecting. The price closed quite near the high of its weekly range. The only negative I can see for bulls is that Gold is still consolidating, even if it is a bullish consolidation, so this bullish movement looks to be quite unique to Silver.
Trading commodities such as Silver long when new six-month highs are reached has been a very profitable strategy in recent decades, so I want to be long of this precious metal right now.
According to the Silver Institute, there was a 15% shortfall in supply compared to demand in 2024, and the market feels this has got even worse during 2025, which has likely helped push prices more than 25% over the course of 2025 so far. So, there seem to be fundamental reasons supporting the bullishness here.

The S&P 500 Index rose again last week as risk sentiment continued to improve, with the price ending very near the high of the week, and significantly, above the major round number at 6,000, at a new three-month high. These are bullish signs, but there are a couple of bearish factors:
- The price has still not cleared the resistance level I have mapped at 6,007.
- The 50-day moving average remains below the 100-day moving average, suggesting that long-term bullish momentum has still not been re-established.
The US stock market tends to perform very well over long periods, and with the price above its level of six months ago and showing some bullish momentum, it might be worth an investment. However, I prefer to remain more cautious, and I want to wait another week at least before going long here, except in the extremely unlikely circumstance that the rises strongly enough to make a new all-time high above 6.142.
The US CPI (inflation) and PPI data due later this week are likely to play a decisive role in whether we get another bullish move this week, or a decline.

I see the best trades this week as:
- Long of the GBP/USD currency pair after a daily (New York) close above $1.3616.
- Long of Silver in USD terms.
- Long of the S&P 500 Index pair after a daily (New York) close above 6,142.
Ready to trade our Forex weekly forecast? Check out our list of the best Forex brokers.