I wrote on 20th July that the best trades for the week would be:
- Long of the NASDAQ 100 Index. This rose over the week by 1.07%.
- Long of the S&P 500 Index. This rose over the week by 1.46%.
- Long of Bitcoin following a daily close above $120,000. This did not set up.
- Long of HG Copper futures following a daily close above $5.6855. This set up on Tuesday and rose over the rest of last week by 1.11%.
- Long of Silver following a daily close above $38.41. This set up on Monday and fell over the rest of last week by 2.88%.
- Long of Palladium in USD terms following a daily close above $1,318. This did not set up.
- Long of Platinum in USD terms following a daily close above $1,1472. This did not set up.
The small overall win of 0.76% equals a gain of 0.10% per asset.
The news last week was dominated by the announcement of a trade deal between the USA and Japan, with Japan agreeing to invest (according to President Trump) $550 billion in the USA and in return being granted a tariff on auto imports at a relatively low rate of 15%. Japan was also in the news as the government lost control of the Upper House of Parliament and Japanese Prime Minister Ishida committed to resigning once he has seen through the implementation of the trade deal with the USA. The Japanese Yen strengthened as a result and the Nikkei 225 Index shot up to reach a new long-term high price. There is an increased prospect now of a change in Japanese monetary policy and that could bring in a big change to long-term weakness in the Yen.
Global stock markets remained buoyant, with major US indices reaching new record highs, while several markets in Asia also advanced especially strongly. It was a relatively quiet week in the Forex market, while precious metals ended the week lower despite their recent strong bull runs.
Other market drivers last week related to certain high-impact data releases, and helped send major US stock market indices to new record highs:
- Japanese Upper House Elections – the government’s loss of control of the Upper House of the Japanese Parliament saw the Yen strengthen, although the trade deal with the US which applies only a 15% tariff to Japanese auto imports may have had a mitigating effect on that.
- European Central Bank – rates were left unchanged at 2.15%.
- New Zealand CPI (inflation) – this was a fraction lower than expected, showing a month-on-month increase of 0.5%. This had little effect on the Kiwi.
- Flash Services PMI & Manufacturing PMI in USA, Germany, UK, and France – the data was mixed.
- US Unemployment Claims – marginally lower than expected.
The coming week has must more vital program of high impact data releases, including three major central bank policy meetings, so we are likely to see more active and volatile markets, especially in Forex.
This week’s important data points, in order of likely importance, are:
- US Federal Funds Rate and FOMC Statement
- US Core PCE Price Index
- US Average Hourly Earnings
- US Advance GDP
- US Non-Farm Employment Change
- US JOLTS Job Openings
- Bank of Japan Policy Rate, Monetary Policy Statement, and Outlook Report
- Bank of Canada Overnight Rate, Monetary Policy Report, and Rate Statement
- Australian CPI (inflation)
- Canada GDP
- US Unemployment Rate
- US ISM Manufacturing PMI
- US Employment Cost Index
- US Unemployment Claims
- China Manufacturing PMI

For the month of August 2025, I forecast that the EUR/USD currency pair will rise in value.
For the month of July 2025, I forecasted that the EUR/USD currency pair would increase in value. The performance of this forecast so far is:

July 2025 Monthly Forecast Performance to Date
I made no weekly forecast last week.
There were no unusually large price movements in currency crosses last week, so I again make no weekly forecast this week.
The Euro was the strongest major currency last week, while the US Dollar was the weakest, although the overall directional movement was very small. Volatility remained low last week, with only 7% of the most important Forex currency pairs and crosses changing in value by more than 1%. Next week’s volatility is likely to increase.
You can trade these forecasts in a real or demo Forex brokerage account.

Last week, the US Dollar Index printed a weakly bearish candlestick which continued the long-term bearish trend, but there was a notably large lower wick which suggests we are seeing significant buying around last week’s lows.
The greenback is caught between the market’s belief that there will be rate cuts later this year, and constant pushback from the Fed over comments from President Trump as to how the pace of cuts should be sooner and faster. Paradoxically, the comments from Trump probably make it harder for the Fed to cut as it must maintain a credible appearance of total independence.
We will see the deadline for US tariff deals at the end of this week, so the contents of any deals announced, or the absence of deals, could cause volatility in the USD. Generally, higher tariffs make the US Dollar stronger, and this may be what is causing the bid at the lows right now.
I think it is wise to trade with the long-term trend while expecting volatility and pullbacks within this trend.

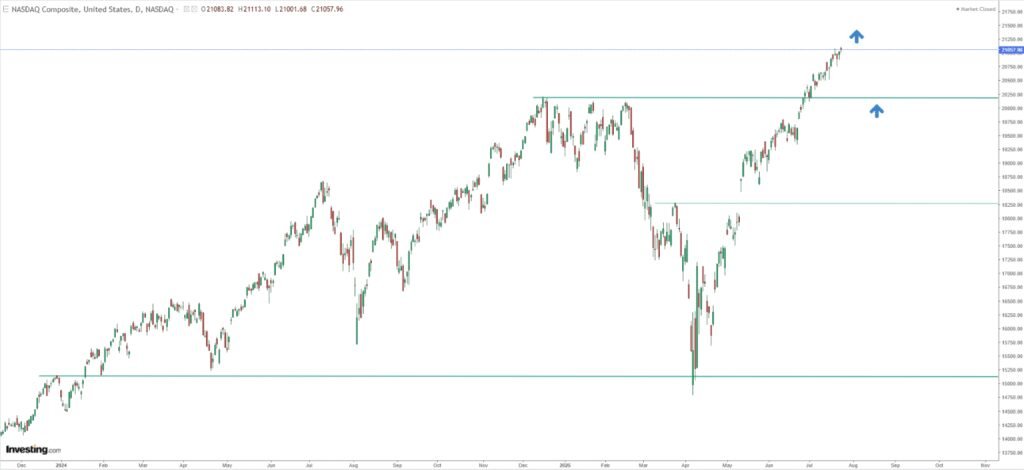
The NASDAQ 100 Index rose firmly last week, printing a bullish candlestick and closing right at its weekly high.
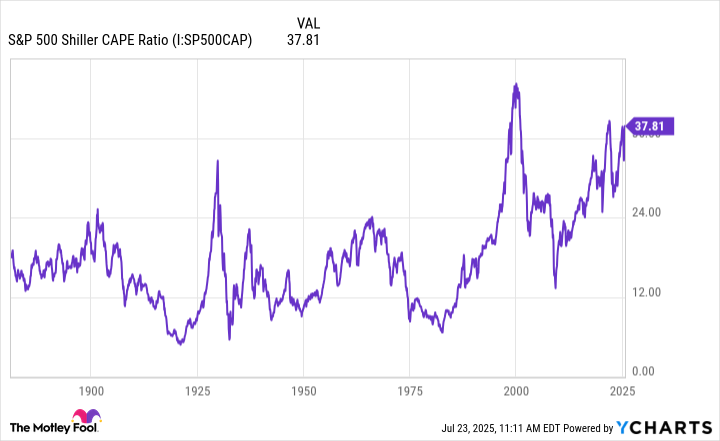
Although there are good arguments for trend traders to remain long here, the rise of recent weeks and months has been very strong, leading to questions being asked about how much longer these breakouts to new record highs can continue.
Despite speculation over a bearish reversal, it is worth noting that when major US indices break to new highs, they typically show a strong rise over the next months, so there are good reasons for trend and momentum traders to be long here.
It is also worth noting that the NASDAQ 100 Index was outperformed last week by the broader NASDAQ 100 Index.

The S&P 500 Index performed very similarly to the NASDAQ 100 Index last week. Everything I wrote above about that tech index also applies here to the S&P 500 Index, with the exception that the S&P 500’s recent price action looks a little more bullish than that of the NASDAQ 100 Index. So, if you are going to be trading these indices long, you might want to give a bit more weight to this Index.

The Japanese Nikkei 225 Index rose very strongly at the start of last week as a US/Japan trade deal was announced that was quite a good deal for Japan. Markets had been concerned about potential negative fallout from an unfavourable deal.
Global stock markets are generally bullish, and Asian markets some of the most bullish – the Korean KOSPI is the best-performing stock markets of any developed economy over the past year.
Despite the bullishness and the strong rise early in the week, note that the price action within the price chart below looks less bullish: the price gave up some of its early gains by the end of the week, and the price did not even touch the all-time high which was made in 2024. The overall price action is also quite ranging.
For these reasons, I would want to see the price close above the record 2024 high of 42,426.77 before considering a long trade entry.

Bitcoin in US Dollar terms enjoyed a strong recent breakout three weeks ago, rising by almost 10% in just a few days to a new record high just above $123,000. However, the price is now consolidating below the key resistance level at $120,055 which is close to the all-time high.
The consolidating looks bullish, and we see long lower wicks on some of the recent daily candlesticks shown in the price chart below. A bullish breakout beyond $120,055 looks likely to happen, although it is not clear how soon this will probably occur.
I am already long of Bitcoin although I hold no special love of the digital currency, and I am sceptical of its true value. Yet, it would be foolish to ignore the potential of trend trades here as it keeps rising into blue sky.
I see a new record high New York close above $120,055 as a suitable trigger for entering a new long trade.

Everything I wrote above about Bitcoin also applies to Ethereum. Recently, its rise has been even more dramatic, although it has not yet made a new all-time high price.
I see a long trade entry in Ethereum following a strong bullish breakout above $4,000 as likely to be a good trade.

The EUR/USD currency pair advanced firmly to a new long-term high a few weeks ago but then made a relatively deep pullback. However, this currency pair is prone to deep pullbacks, and in this case, it did not stop the bullish long-term trend, which has again become dominant in recent days.
The price is now not far from its long-term high daily closing price at $1.1812. I think a long trade entry following a higher daily close above that price could be a good trade. We are having something of a consolidation right now, but the price action looks basically bullish.
Fundamentals and sentiment likely also support a long trade here, with the European Central Bank passing on a rate hike and the US Dollar in a bearish long-term trend.
What might change everything and cause a lot of volatility is the work currently underway to agree a trade deal between the EU and the USA. If a deal is reached, as President Trump commented this weekend, it would be the biggest trade deal of all, and its terms could send the Euro and even the USD moving strongly in unexpected directions with higher volatility.

We have lately seen some relative strength in metals generally, especially precious metals. Silver is a bit of both. Silver was very strong early last week, rising to make new 13-year highs well above $39 per ounce, but it gave up most of its gains later in the week.
I think a new long trade will make sense if we get a New York close at or above $39.30 per ounce, although more cautious traders might want to wait for the big round number at $40.00 to be taken out.
The daily price chart below shows a linear regression analysis, although this does not look like a strong price channel, suggesting high volatility is possible, so size any position you take here respectfully. It also shows that the price is above the top of the channel, which is a potentially bearish sign when new highs are not being made, as is the case over the past few days. The recent price action is also suggestive of a bearish reversal.

Platinum’s recent rise has been very strong and dramatic, and it is currently trading near its multi-year high price, although it has certainly made a moderate bearish retracement. These are bullish signs, although the question is open how much further this bullish move might run.
I am currently long of a Platinum ETF, and it will make sense to enter a new long trade if we see a daily close here above (based on the NYMEX future). The appropriate and affordable ETF to use is PPLT.
All precious metals declined last week, with the long-term trend in Palladium arguably over, and Gold not far behind that, so we may have seen the end in the current bullish trend in precious metals. However, the recent spectacular bullish momentum suggests another bullish breakout could be a signal worth getting involved with.

Copper made a high upwards leap two weeks ago upon President Trump’s declaration that all imports of Copper into the USA would be subject to a 50% tariff. These high prices in Copper have never been seen before – they are all-time highs, which is rare to see in a commodity.
The price made another advance after a consolidation, as can be seen in the daily price chart below. The current bearish retracement off the record high price made earlier this week is small, which is a bullish sign. However, it is worth noting the large upper wicks at the high, which is a small but significant bearish sign.
As a trend trader, I already entered a long position here. A careful course of action for anyone not already long might be entering a new long trade following a new all-time high New York closing price above $5.9585 (or even $6 for the cautious) in the copper future HG.
 Daily Price Chart 27/07/2025")
I see the best trades this week as:
- Long of the NASDAQ 100 Index.
- Long of the S&P 500 Index.
- Long of Bitcoin following a daily close above $120,055.
- Long of Ethereum following a daily close above $4,000.
- Long of EUR/USD following a daily close above $1.1812.
- Long of HG Copper futures following a daily close above $5.9585 or $6 for more conservative traders.
- Long of Silver following a daily close above $39.30 or $40 for more cautious traders.
- Long of Platinum in USD terms following a daily close above $1,1500.
Ready to trade our Weekly Forex forecast? Check out our list of the top 10 Forex brokers in the world.