Is the US dollar finally ready to break out of its range, or will next week bring more chop?
We just had hotter PPI, softer CPI, and an ECB decision that left rates unchanged. But so far, the charts are telling us one obvious thing.
In today’s Weekly Forex Forecast, I’ll share my trade plan for the DXY, EURUSD, GBPUSD, and XAUUSD. We’ll talk key levels, bullish and bearish scenarios, and potential targets for next week.
US Dollar Index (DXY) Forecast
The US dollar index stayed locked in its range last week.
Hotter PPI on Wednesday and softer CPI on Thursday didn’t push the DXY out of its comfort zone. Even the ECB’s decision to hold rates and delay cuts couldn’t spark a breakout.
That shows the DXY is respecting its technical levels. It also shows a lack of conviction, which has been the theme since early August.
Support for the US dollar index sits at 97.70. Resistance remains 98.60.
Watch how this week closes in relation to 97.70. A weekly close below would open up the 96.70 poor lows (unfinished auctions). A weekly close above keeps the 97.70 – 98.60 range intact a while longer.
A sustained break below 97.70 on the daily chart would expose 96.70–96.60. That zone lines up with the 2011 channel support and two poor lows, or unfinished auctions.
Inefficiencies like the ones at 96.70 often serve as “magnets” for a market.
On the flip side, a sustained close above 98.60 would put 99.35 on the map. Beyond that, the 99.88 imbalance from August is open for business.
That single print remains an upside target, with the descending trendline near 100.00 acting as the bigger barrier for the US dollar index.
Structurally, the DXY still leans bearish. The lower highs since August show sellers are active around resistance. But buyers continue to defend 97.70, keeping the floor intact for now.
That leaves the US dollar index stuck in its sideways range.
Key takeaways:
- Sustained break below 97.70 on a weekly closing basis = 96.70
- Hold above 97.70 on a weekly closing basis = 98.60 potential
Join us in the VIP Discord group for real-time updates on GBPUSD and other markets, which includes VIP-only videos, my trades in real time, and the complete trading course.
 1")
EURUSD Forecast
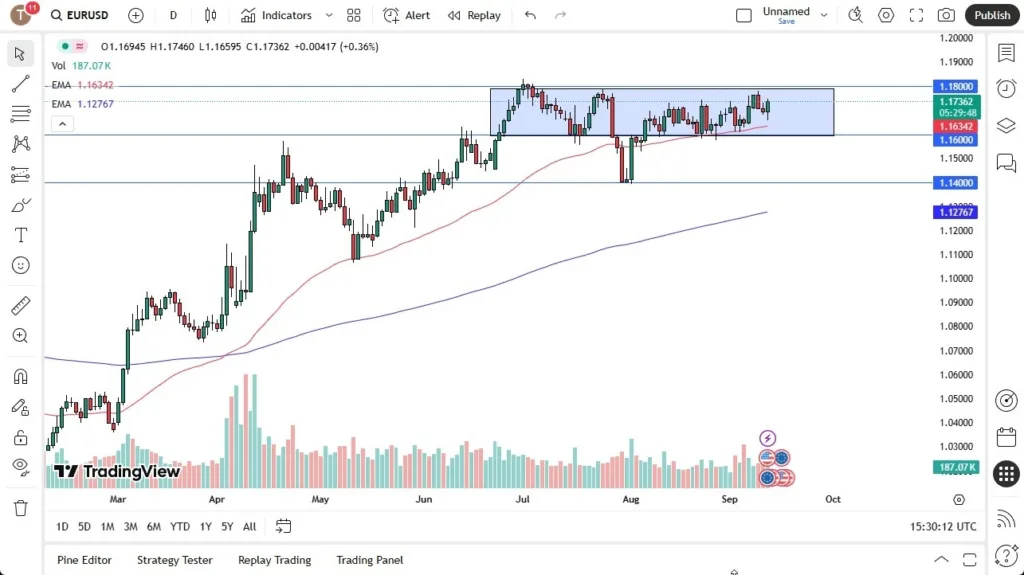
EURUSD spent last week consolidating just above trend line support.
The pair held firm after the ECB left rates unchanged. Lagarde stressed that policy will remain restrictive and that cuts aren’t on the table yet.
That gave the euro some short-term support and helped keep EURUSD pinned near its recent highs.
Key support remains the 1.1715 area we’ve discussed. Like the DXY, this level is most significant on the weekly time frame, not the daily.
That’s also near the February trend line support, which now sits at 1.1690. As long as the euro is above that mark, the pair remains constructive.
Immediate resistance is 1.1780. Above that sits 1.1810–1.1817, which includes a poor high from August. If EURUSD can clear that zone on a sustained daily close, the 1.1908 high comes into play.
However, if that scenario unfolds, pay close attention to the DXY and 96.60 support.
On the downside, a sustained break below 1.1690 would expose 1.1587–1.1564. That area includes some August lows and a poor low that remains open for business.
A deeper move would target 1.1453, where a single print from May remains open.
For now, EURUSD lacks conviction. If you don’t already have a position in these markets, it’s a good time to do nothing.
Key takeaways:
- Above 1.1690 = bullish trend intact, and 1.1800 resistance
- Below 1.1690 = breakdown toward 1.1560-1.1580
 2")
GBPUSD Forecast
GBPUSD tested resistance at 1.3579 last week but couldn’t close above it.
Given its significance since July, it’s clear that 1.3580 is the level for bulls to break. However, it’s resistance as of this forecast.
If we get a sustained break above 1.3580, we could see GBPUSD move into 1.3618. That’s a poor high from August, and it’s still open for business.
Above that, the single prints at 1.3686, 1.3714, and 1.3730 are all upside targets, but only on a sustained break above 1.3580.
If GBPUSD breaks back below 1.3540 on a daily basis, the first level I’m watching is 1.3484. That’s a poor low that hasn’t been cleaned up yet.
A break there could take the pair to 1.3418.
Like EURUSD, the pound remains incredibly indecisive. It’s one of those times in the markets when no trade is the best trade.
Key takeaways:
- Above 1.3580 = 1.3618 and the 1.3700 imbalances from July
- Below 1.3540 = a rotation back into the range toward 1.3484
 3")
XAUUSD (Gold) Forecast
Gold had a strong week, closing above 3,500 for the second time and pushing higher into its 2024 ascending channel.
With XAUUSD trading at all-time highs, there’s a lack of clear resistance levels. Apart from the 2024 channel resistance, you have “big round numbers” like $3,700, $3,800, $3,900, and especially $4,000.
The first obvious target is 3,700. If buyers keep pressing, 3,800 would be the next psychological level to watch. Beyond that, the channel resistance comes into play, and that’s where things could get heavy.
As for support, 3,500 is obvious. But as mentioned recently, I would be surprised to see a pullback that deep, especially if XAUUSD bulls hope to remain in control.
Gold is a textbook dip-buying market at the moment. However, two sell-side single prints at $3,601 and $3,563 could come into play next week.
A retest of either level next week could offer a chance to buy the dip before the next leg up.
Key takeaways:
- Single prints at $3,601 and $3,563 = potential buying opportunities
- Key resistance = big round numbers ($3,700, $3,800, etc.)
Join us in the VIP Discord group for real-time updates on GBPUSD and other markets, which includes VIP-only videos, my trades in real time, and the complete trading course.
 4")