A seldom-observed event on Wall Street portends trouble for stocks.
This year has served as a good reminder of what a superior wealth creator the stock market can be for patient investors. Despite a tariff-related swoon in equities in late March and early April, Wall Street’s health barometer, the S&P 500 (^GSPC -2.71%), along with the ageless Dow Jones Industrial Average (^DJI -1.90%) and innovation-driven Nasdaq Composite (^IXIC -3.56%), have all pushed to numerous record-closing highs.
There’s plenty for investors to be excited about, including the rise of artificial intelligence (AI), the emergence of quantum computing, the prospect of future interest rate cuts, and some sort of coming resolution as to whether or not President Donald Trump’s tariffs will remain in place. Anything that makes Wall Street more predictable tends to be highly valued by investors.
But new all-time highs for the S&P 500, Dow Jones, and Nasdaq Composite aren’t the only history being made. We just witnessed the stock market do something that’s occurred only three times (including the newest incident) since January 1871. And based on what history tells us, it bodes poorly for stocks, at least in the coming quarters and/or years.

Image source: Getty Images.
The stock market just made history — but not the good kind
While record highs for the S&P 500, Dow, and Nasdaq Composite are front-page news, what’s happening with stock valuations is equally important.
To set the record straight, there isn’t a one-size-fits-all blueprint when it comes to valuing individual stocks or the broader market. Everyone has their own view and approach to determining what’s cheap and what’s pricey, which is what makes the stock market so unpredictable in the first place.
But in spite of this subjectivity, there is one valuation tool that leaves no margin for error. This metric can look back more than 150 years and provide the closest thing to an apples-to-apples comparison when evaluating the relative cheapness or priciness of Wall Street’s benchmark index, the S&P 500. I’m talking about the famed Shiller price-to-earnings (P/E) ratio, which is also referred to as the cyclically adjusted P/E (CAPE Ratio).
What makes the Shiller P/E different from the traditional P/E is the scope of earnings taken into consideration. Whereas the traditional P/E is arrived at by dividing a company’s share price by its trailing-12-month earnings per share (EPS), the Shiller P/E is based on average inflation-adjusted EPS over the prior 10 years. Accounting for and inflation-adjusting a decade’s worth of EPS history ensures that shock events and recessions won’t render this valuation tool useless.
When back-tested 154 years to January 1871, the S&P 500’s Shiller P/E has averaged a multiple of 17.29. You’ll note that it has spent much of the last 30 years above this 154-year average, which is a reflection of the internet democratizing access to information, as well as interest rates declining throughout the 2010s.
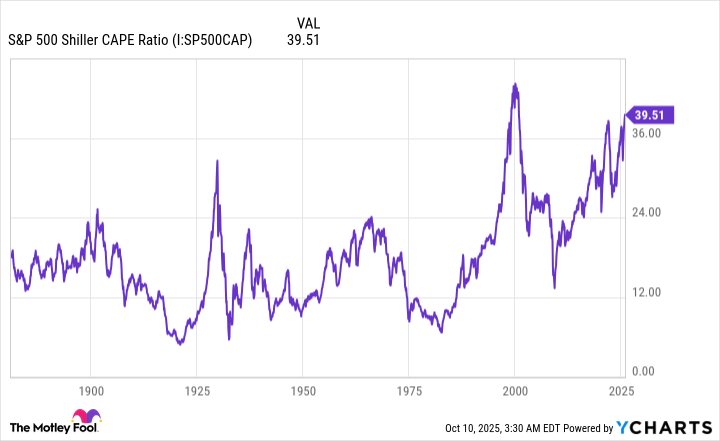
S&P 500 Shiller CAPE Ratio data by YCharts.
However, there’s a limit as to how far these valuation premiums can be stretched, based on what history tells us.
On Oct. 8, the S&P 500’s Shiller P/E closed at a multiple of 40.32, which represents the high-water mark for the current bull market rally that began three years ago. It’s also a 133% premium to the aforementioned average multiple over 154 years.
The real eye-opener is comparing this peak reading of 40.32 in the current bull market to prior peaks during other continuous bull markets.
Since 1871, there have been only three instances when the S&P 500’s Shiller P/E has topped 40:
- In December 1999, on the heels of internet-fueled euphoria, the Shiller P/E peaked at its highest-ever reading, 44.19.
- During the first week of January 2022, with fiscal stimulus lining the pockets of consumers, the Shiller P/E topped 40 by a few hundredths.
- On Oct. 8, 2025, it hit the aforementioned high of 40.32.
While we can’t accurately forecast the future, the past is crystal clear as to what comes next for stocks. Following the December 1999 peak, the S&P 500 and Nasdaq Composite shed 49% and 78% of their values, respectively, through 2002. Meanwhile, the S&P 500 lost 25% of its value during the 2022 bear market.
In fact, there have only been six instances since 1871 where the Shiller P/E has surpassed 30 (for a period of at least two months) during a continuous bull market. Each of the previous five occurrences were followed by declines in the S&P 500, Dow, and/or Nasdaq Composite ranging from 20% to 89%.

Image source: Getty Images.
Though short-term disaster awaits (based on history), the long-term future for stocks is bright
Based solely on what history tells us, Wall Street’s major stock indexes are headed for eventual disaster. Although the Shiller P/E readings aren’t helpful in determining when equity valuations will enter into a correction or bear market, what they do show is that premium valuations aren’t well tolerated over extended periods.
But the great thing about history is that it can offer insight to the upside as well.
On one hand, historical precedent shows us that stock market corrections, and bear markets — and even the occasional elevator-down stock market crash, as we witnessed in early April — are normal and inevitable aspects of the investing cycle. Not even fiscal and monetary policy moves can prevent these downturns from taking shape.
Yet nearly a century of history shows that Wall Street’s most significant downdrafts — its 20% or greater bear market declines — are generally short-lived.
When the S&P 500 officially entered the current bull market in June 2023 (i.e., when it had firmly risen 20% from its October 2022 bear market low), the researchers at Bespoke Investment Group published a data set to X (formerly Twitter) that compared the length of every S&P 500 bull and bear market dating back to the beginning of the Great Depression in September 1929.
It’s official. A new bull market is confirmed.
The S&P 500 is now up 20% from its 10/12/22 closing low. The prior bear market saw the index fall 25.4% over 282 days.
Read more at https://t.co/H4p1RcpfIn. pic.twitter.com/tnRz1wdonp
— Bespoke (@bespokeinvest) June 8, 2023
Bespoke examined 54 events in total (27 bear markets and 27 bull markets) and found quite the disparity between the calendar-day length of moves higher and lower in the benchmark index. Whereas the typical S&P 500 bear market endured for only 9.5 months (286 calendar days), the average bull market persisted for about two years and nine months (1,011 calendar days), as of June 2023.
What’s more, Bespoke’s data set notes that the longest S&P 500 bear market since September 1929 lasted 630 calendar days. If the current bull market was extrapolated to present day, it would be the 14th of 27 bull markets to last longer than 630 calendar days.
Statistically speaking, disaster may await stocks in the short term. But when examined over one or more decades, history conclusively shows that long-term investors remain well positioned to grow their wealth.