Watch Energy, Risk Shifts (Chart)

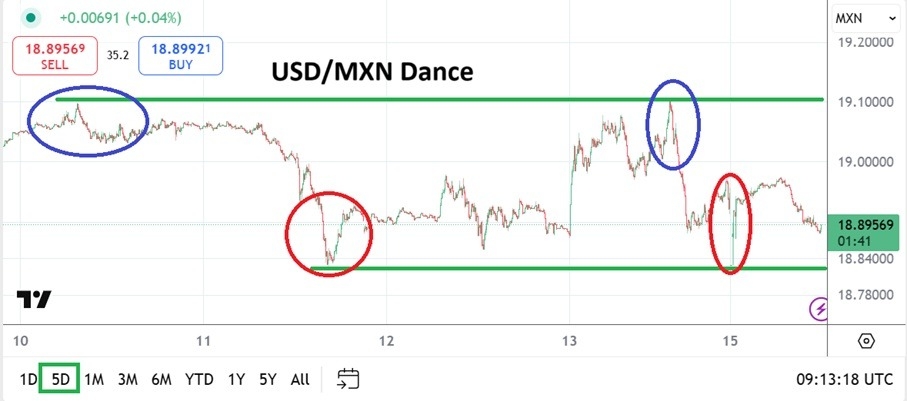
The USD/MXN has seen a rather solid trading range emerge the past handful of days, and as of this morning the currency pair is around the 18.88875 depending on fluctuations being demonstrated.

USD/MXN Today 16/06: Watch Energy, Risk Shifts (Chart)

The USD/MXN has provided traders with a rather tempting range the past handful of days. This doesn’t mean it is particularly safe to wager on however. Risk adverse trading shadows are certainly lurking in the global markets this morning, even though it is clear financial institutions are showing behavioral sentiment appears to remain rather calm in the wake of the escalating Middle East concerns.

The USD/MXN is near the 18.88875 ratio as of this writing. A high of nearly 19.10000 was seen on Friday, this a handful of hours after noise from the Middle East increased. However, the USD/MXN also touched the 19.10000 vicinity Tuesday the 10th of June, two and a half days before war broke out between Israel and Iran. Intriguingly though, WTI Crude Oil prices did start to become volatile on the same Tuesday, this as rumors about embassies closing started to be heard from the Middle East.

Energy Prices and the USD/MXN

The correlation of higher energy prices and the USD/MXN should be considered, but cannot be proven – yet it offers some speculative considerations. After touching Friday’s high, the USD/MXN did reverse lower and it began testing the 18.90000 ratio. Upon opening early today the USD/MXN fell again and tested the 18.82800 with a lower spike, but then quickly climbed back to its current ratios a bit higher.

Mexico is a large producer of energy. If Middle Eastern conflict heightens and oil infrastructure in Iran comes into play as a tool for aggressive retribution, not only will WTI Crude Oil prices become volatile, but a knock on effect may be seen in the USD/MXN. Traders of the currency pair should not get over confident about their opinions in the short-term, even the near-term will need constant vigilance for wagers due to the potential of risk appetite in global markets shifting suddenly.

Resistance Levels and Bearish Wagers on Lower Value

The USD/MXN has shown the ability to trade below the 19.00000 level in what can be considered a rather sustained manner since Wednesday of last week – yes there was a definite move upwards on Thursday and Friday as fears hit global markets, but then calm prevailed again.

  • Support has been seen around the 18.83000 ratio and this mark will prove interesting for speculators aiming for lower targets.
  • The USD/MXN does have the capability of trading fast, and because of the current dynamics in the markets day traders need to be braced for sudden gusts which could alter sentiment from afar.
  • Looking for lower momentum in the USD/MXN may feel worthwhile as a wager, but speculators need solid risk management over the next few days.

USD/MXN Short Term Outlook:

Current Resistance: 18.89750

Current Support: 18.87980

High Target: 18.95100

Low Target: 18.84600

Ready to trade our Forex daily analysis and predictions? Here are the best forex brokers in Mexico to choose from.

Source link

Visited 1 times, 1 visit(s) today

Related Article

XM Launches Revamped Competitions Platform | New Formats

XM Launches Revamped Competitions Platform

By DailyForex Press Release Created on June 16, 2025 XM has officially launched its revamped competitions platform, introducing enhanced features, new competition types, and powerful tools designed to elevate the trading experience. Whether you’re a seasoned trader or just starting out, the newly enhanced platform delivers a more dynamic, competitive, and engaging environment tailored to

ET logo

Rupee ends nearly flat following choppy trading; forward premiums dip

The Indian rupee experienced choppy trading before ending nearly flat on Monday as a broad based decline in the U.S. dollar blunted risk aversion spurred by the escalation in the Iran-Israel conflict. The rupee closed at 86.0650 against the U.S. dollar, nearly unchanged from its close of 86.08 in the previous session. The South Asian

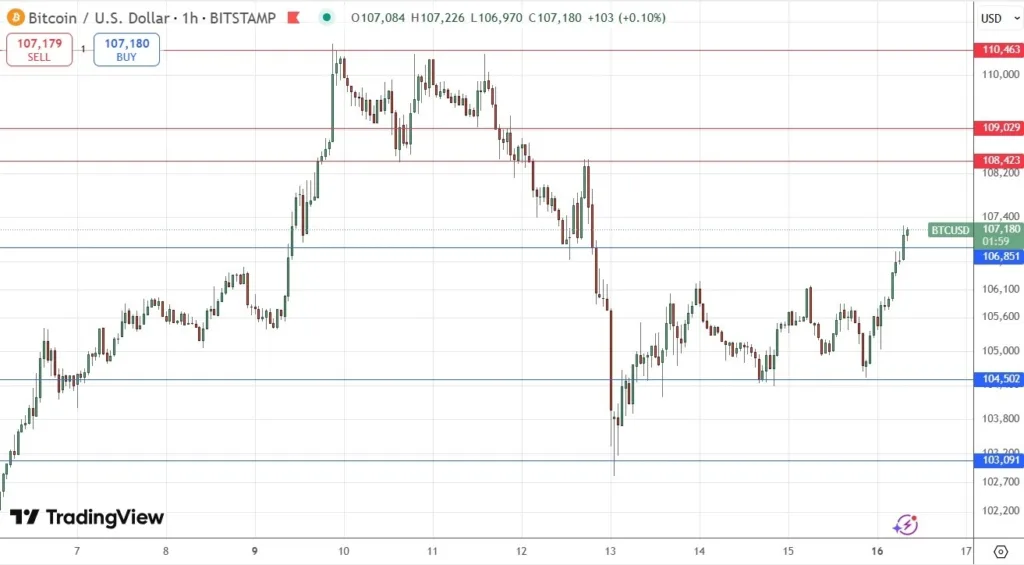
BTC/USD Forex Signal Today 16/06: Bullish Breakout (Chart)

BTC/USD Forex Signal Today 16/06: Bullish Breakout (Chart)

My previous BTC/USD signal on 9th June was not triggered, as there was no bearish price action at any of the identified resistance levels. Today’s BTC/USD Signals Risk 0.50% per trade. Trades must be entered prior to 5pm Tokyo time Tuesday. Long Trade Ideas Go long after a bullish price action reversal on the H1

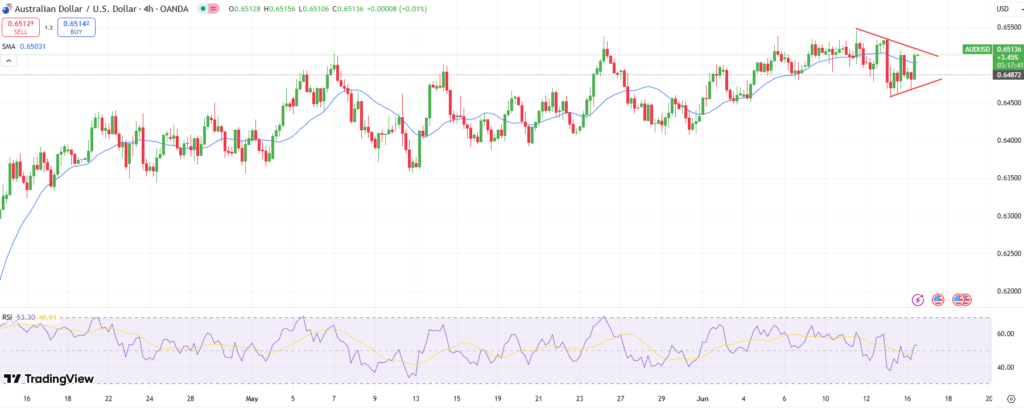
AUD/USD Price Technical Analysis

AUD/USD Price Gains Amid Upbeat Chinese Data

The AUD/USD price recovers as Israel may head for a ceasefire with Hammas. China’s upbeat retail sales data boosts Aussie. US dollar stays weaker amid improved risk and dovish FOMC. The AUD/USD price recovers ground as the geopolitical tension cools down after Israel proposed a revised deal to negotiate with Hammas for the hostages. The

A stock chart displayed on a computer monitor that's being reflected on the eyeglasses of a money manager.

Billionaire Stanley Druckenmiller Dumped His Entire Stake in Palantir and Has Piled Into This Suddenly Unstoppable Drug Stock for 3 Straight Quarters

Duquesne Family Office’s billionaire chief sold every share of Wall Street’s hottest artificial intelligence (AI) stock in favor of a drugmaker whose shares have surged 142% in two years. There’s nothing more valuable on Wall Street than data, and investors rarely have to dig to find something that’s pertinent to the U.S. economy, the stock

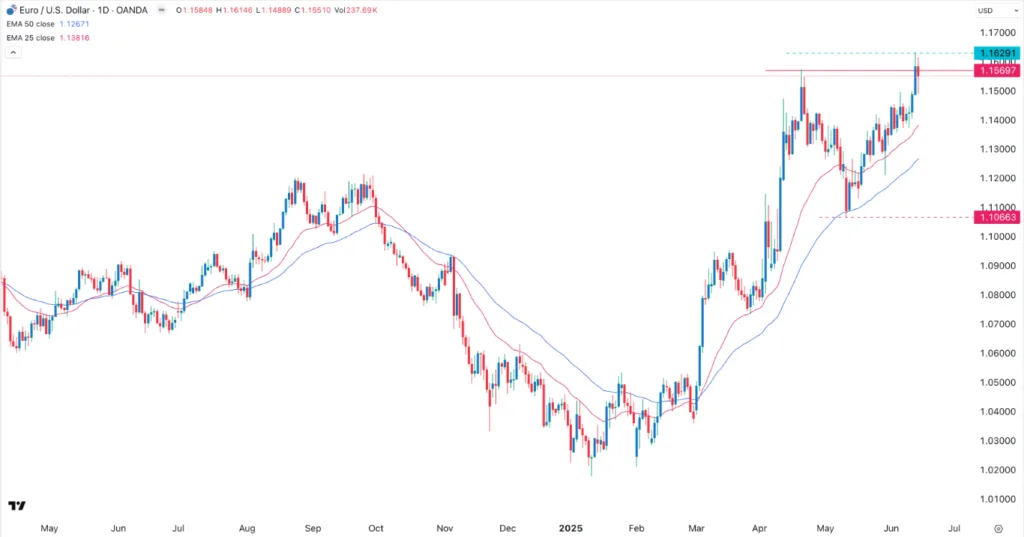
EUR/USD Forex Signal Today 16/06: Double-Top Pattern (Chart)

EUR/USD Forex Signal Today 16/06: Double-Top Pattern (Chart)

Bearish view Sell the EUR/USD pair and set a stop-loss at 1.1400. Add a stop-loss at 1.1635. Timeline: 1-2 days. Bullish view Buy the EUR/USD pair and set a take-profit at 1.1635. Add a stop-loss at 1.1400. The EUR/USD exchange rate rose and is hovering at its highest point since November 2021 as the dollar

ET logo

middle east conflict: Iran-Israel Military Strikes: Tel Aviv Stock Exchange recovers after a sharp early drop as both militaries ‘show’ grave concern for other nation’s civilians’ safety

The Tel Aviv Stock Exchange showed recovery on Sunday after a sharp early drop. The rebound came during increased military tension between Israel and Iran. Markets responded to uncertainty as both countries continued to launch attacks. Military and civilian warnings also increased on both sides. Stock Market Shows Partial Recovery The TA-35 index closed 0.5%

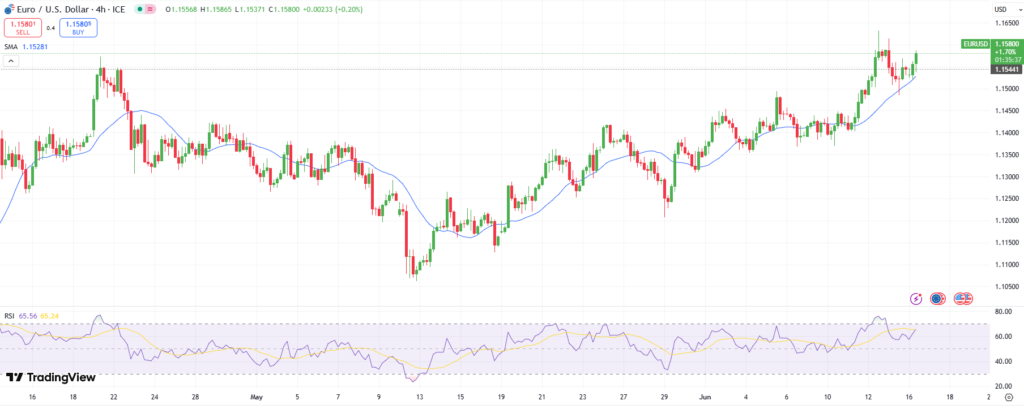
EUR/USD Technical Price Analysis

EUR/USD Price Recovers as Geopolitical Tension De-escalates

The EUR/USD price sees a fresh buying wave as geopolitical tensions de-escalate. The ECB’s shift of tone may provide an additional boost to the euro. Market participants are eyeing the FOMC meeting this week. The EUR/USD price maintains a strong bullish momentum despite the Middle East tension that weighed on the pair on Friday. The

0
Would love your thoughts, please comment.x
()
x