USD/JPY Outlook: Caution Builds as US CPI Report Looms

  • The USD/JPY outlook shows some indecision in the market ahead of the US CPI.
  • Economists are forecasting a US headline figure of 2.8%.
  • Trade tensions between China and the US might increase.

The USD/JPY outlook shows some indecision in the market as traders look forward to crucial US inflation figures. Meanwhile, the uncertainty surrounding the deadline for a trade deal between the US and China looms.

Are you interested to learn more about ECN brokers? Check our detailed guide-

This week, the US will release its pivotal CPI report. This will show the state of inflation in the country and will shape the outlook for rate cuts. Economists are forecasting a headline figure of 2.8%, higher than the previous reading of 2.7%. Meanwhile, the monthly figure might increase by 0.2%, slower than the previous increase of 0.3%. An unexpected outcome will increase market volatility in either direction.

Meanwhile, talks between China and the US have dragged on with no clear trade deal. The August 12 deadline is nearing, and if there is still no deal, tensions between the two countries might increase. This would also increase market volatility. The yen would benefit due to its safe-haven nature. 

“If I’d be playing it any way, I’d be long volatility this week,” said Tim Kelleher, head of institutional FX Sales at Commonwealth Bank in Auckland, citing the unpredictability of the looming events.

USD/JPY key events today

Neither the US nor Japan will release any high-impact reports today. Therefore, the pair might consolidate ahead of the US inflation numbers.

USD/JPY technical outlook: Bulls eye the 149.01 resistance level

USD/JPY technical outlookUSD/JPY technical outlook
USD/JPY 4-hour chart

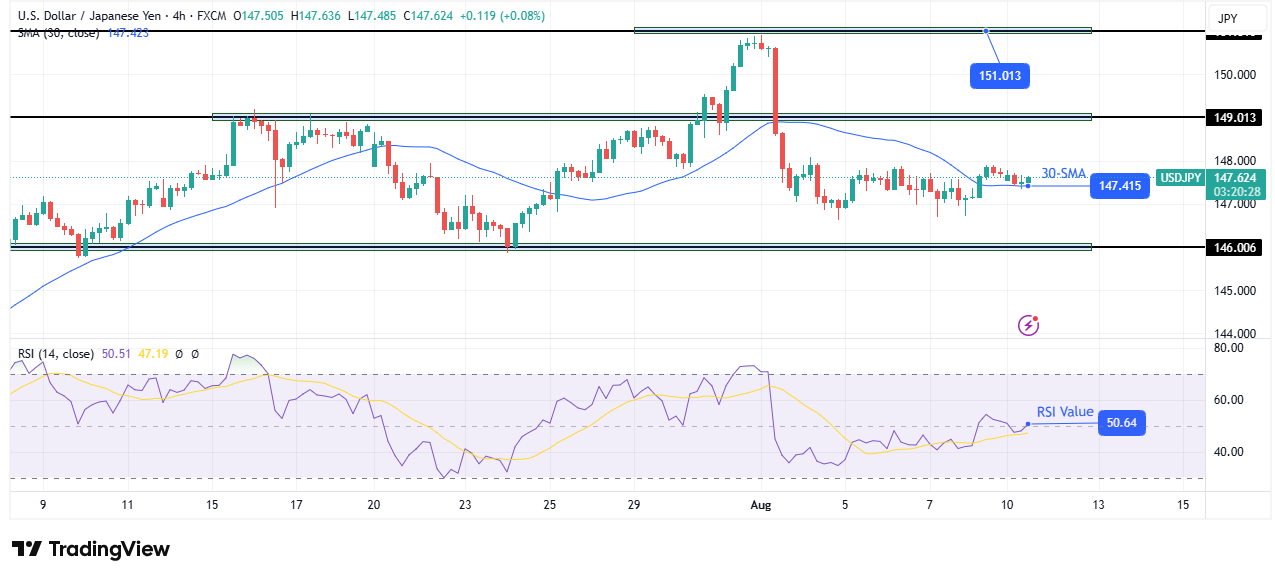
On the technical side, the USD/JPY price has broken above the 30-SMA and has pulled back to retest it. The break indicates a shift in sentiment to bullish. At the same time, the RSI has gone above 50, suggesting stronger bullish momentum. 

Are you interested to learn more about day trading brokers? Check our detailed guide-

If bulls find their footing above the SMA, the price will likely climb to retest the 149.01. A break above this level would confirm a new uptrend. On the other hand, if the price fails to make much movement above the SMA, it might drop back below to retest the 146.00 support level. A break below this support would signal a downtrend. 

However, USD/JPY has lacked direction on a larger scale for some time. Instead, it has been making swings that keep chopping through the SMA. If this continues, there will be no trend in either direction.

Looking to trade forex now? Invest at eToro!

68% of retail investor accounts lose money when trading CFDs with this provider. You should consider whether you can afford to take the high risk of losing your money.

Source link

Visited 1 times, 1 visit(s) today

Related Article

Gold Analysis Today 11/08: Gold Price Is Rising (Chart)

Gold Price Is Rising (Chart)

Created on August 11, 2025 Today’s Gold Analysis Overview: The overall Gold Trend: Strongly bullish. Today’s Gold Support Levels: $3,378 – $3,360 – $3,300 per ounce. Today’s Gold Resistance Levels: $3,415 – $3,440 – $3,480 per ounce. Today’s Gold Trading Signals: Sell gold from the resistance level of $3,435, with a target of $3,320 and

EUR/USD Forecast 11/08: Continues to Consolidate (Chart)

EUR/USD Forecast 11/08: Continues to Consolidate (Chart)

Created on August 11, 2025 The euro has gone back and forth during the trading session on Friday, as we continue to hover just above the 1.16 level. This is a pair that had recently formed a bit of a double top, only to plunge toward the 1.14 level. The 1.14 level is a large,

How to Get Forex Signals for Free in 2025?

How to Get Forex Signals for Free in 2025?

In the fast-paced world of Forex trading, timing and accuracy can make or break your strategy. That’s where live Forex signals come into play. These real-time alerts can guide traders on what to trade, when to enter, and when to exit — even if they don’t have years of technical experience. And the best part?

EUR/USD Analysis 11/08: Trading in Narrow Ranges (Chart)

Trading in Narrow Ranges (Chart)

Created on August 11, 2025 EUR/USD Analysis Summary Today Overall Trend: Preparing for an upward shift. Today’s EUR/USD Support Levels: 1.1600 – 1.1550 – 1.1470. Today’s EUR/USD Resistance Levels: 1.1700 – 1.1770 – 1.1860 EUR/USD Trading Signals: Buy EUR/USD from the support level of 1.1560, with a target of 1.1900 and a stop loss of

Nvidia pushes back on accusations its H20 chips pose a national security risk in China

Trump Nvidia, AMD China chip revenue deal implications

Nvidia and AMD have agreed to share some of their revenue from sales to China with the U.S. government, according to several reports, sparking debate about whether the move could impact the chip giants’ business and whether Washington might seek out similar deals. In exchange for 15% of revenues from the chip sales, the two

Nvidia Forex Signal 11/8: Threatens Another Breakout (Chart)

Nvidia Forex Signal 11/8: Threatens Another Breakout (Chart)

Created on August 11, 2025 Potential signal: If NVDA breaks above the $185 level, I’d be aiming for the $197 level. Stop loss at the $175 level. During the trading session on Friday, we have seen Nvidia rally again, as it looks like we are trying to break above the shooting star that formed on

USD/MXN Analysis 11/08: Mid-Term Low Challenged (chart)

USD/MXN Analysis 11/08: Mid-Term Low Challenged (chart)

Created on August 11, 2025 The USD/MXN continues to show a tendency to trend downwards and is near the 18.59800 ratio as of this writing with fast changes in values, this after going into the weekend with its low for the week and within sight of important support levels. After the USD/MXN traversed higher in