USD/JPY Forecast: Dollar Rebounds after US-Vietnam Trade Deal

  • The USD/JPY forecast shows a rebound as the dollar gains on trade optimism.
  • The US economy lost 33,000 private jobs in June.
  • Economists expect 120,000 new US jobs, a slowdown from the previous month.

The USD/JPY forecast shows a rebound as the dollar gains on trade optimism. However, downbeat employment figures in the previous session led to an increase in Fed rate cut expectations. Market participants are now looking forward to the nonfarm payrolls report. 

Are you interested in learning more about MT5 brokers? Check our detailed guide-

The dollar strengthened on Thursday after news of a trade deal between the US and Vietnam. The news raised hopes of more deals before the July 9 deadline for reciprocal tariffs. The progress in trade talks has been slow, and there are concerns that tariffs will increase again soon. Therefore, any new deal boosts market sentiment. 

However, the dollar remains under pressure after data in the previous session revealed weak private employment. The economy lost 33,000 private jobs in June. Meanwhile, economists had expected 99,000 new jobs. The report raised concerns about the state of the labor market. At the same time, it increased the likelihood of a Fed rate cut in July. 

All eyes are now on the nonfarm payrolls. Economists expect 120,000 new jobs, a slowdown from the previous month. Moreover, unemployment might increase from 4.2% to 4.3%. Softer-than-expected figures will weigh on the dollar by adding pressure on the Fed to lower borrowing costs.

USD/JPY key events today

  • US average hourly earnings m/m
  • US nonfarm employment change
  • US unemployment rate
  • US ISM services PMI

USD/JPY technical forecast: Price retests trendline after recent break

USD/JPY technical forecastUSD/JPY technical forecast
USD/JPY 4-hour chart

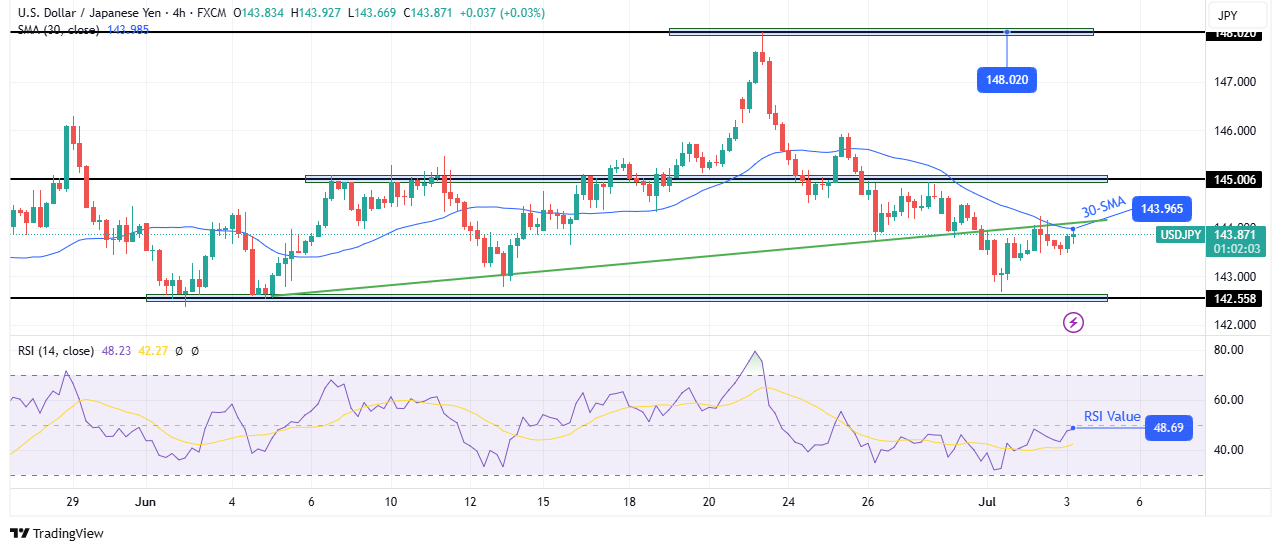
On the technical side, the USD/JPY price has broken below its bullish trendline to make a lower low. The move has strengthened the bearish bias. However, the price has pulled back to retest the recently broken trendline and the 30-SMA. However, the price remains below the SMA, with the RSI under 50, indicating that bears are still in the lead. However, this might change. 

Are you interested in learning more about forex signals telegram groups? Check our detailed guide-

The current resistance zone must hold firm to allow the price to bounce lower and confirm the breakout. If this happens, the USD/JPY pair will likely drop to retest the 142.55 support level. 

On the other hand, if bulls are stronger, the price will likely break above the resistance zone. Still, to confirm a new bullish move, the price would need to break above the 145.00 resistance level. 


Looking to trade forex now? Invest at eToro!

68% of retail investor accounts lose money when trading CFDs with this provider. You should consider whether you can afford to take the high risk of losing your money.

Source link

Visited 1 times, 1 visit(s) today

Related Article

Gold Analysis 03/07: Weakness Continues to Support Gold (graph)

Gold Analysis 03/07: Weakness Supports Gold (Chart)

Today’s Gold Analysis Overview: The overall Gold Trend: Bullish. Today’s Gold Support Levels: $3328 – $3280 – $3220 per ounce. Today’s Gold Resistance Levels: $3372 – $3390 – $3420 per ounce. Today’s gold trading signals update: Sell Gold from the resistance level of $3393 with a target of $3300 and a stop-loss at $3420. Buy

A roadside currency exchange vendor counts notes in New Delhi. File

Rupee falls 8 paise to 85.70 against U.S. dollar in early trade

A roadside currency exchange vendor counts notes in New Delhi. File | Photo Credit: Reuters The rupee depreciated 8 paise to 85.70 against the U.S. dollar in early trade on Thursday (July 3, 2025) amid renewed headwinds from global risk sentiment and persistent foreign fund outflows. Forex traders said the rupee was trading in a

S&P 500 Flashes Golden Cross, a Bullish Signal for More Stock Gains

S&P 500 Flashes Golden Cross, a Bullish Signal for More Stock Gains

After hitting record highs in recent days, the S&P 500 just flashed an indicator for more gains ahead. On Tuesday, the index’s 50-day moving average of 5,846.34 closed above its 200-day moving average of 5,837.96, a bullish technical pattern known as a golden cross. It’s the first time the indicator has flashed since February 2023.

President Donald Trump speaks to the Press before departs at the White House to Alligator Alcatraz, Florida

Trump’s Big ‘Growth’ Brag Gets Hit With an Immediate Reality Check

President Donald Trump’s boast that the U.S. is experiencing economic “growth” at levels “never seen before” was quickly fact-checked by a damning jobs report. New data showed private sector employment fell by 33,000 jobs in June, payroll processing firm ADP announced Wednesday. Not only is this figure far below the estimated gain of 95,000 jobs

A large golden dollar sign on a stack of gold coins.

Meta Platforms Stock Will Beat the Market. Here’s Why.

Halfway through 2025, one thing is clear: It’s been another excellent stretch for Meta Platforms‘ (META -0.14%) stock. As of this writing, Meta shares are up 25% year to date, easily besting the benchmark S&P 500‘s total return of 6% and making Meta the top-performing stock among the Magnificent Seven. So, will this trend continue?

USD/BRL Analysis Today 02/07: Trading Lessons (Chart)

USD/BRL Analysis Today 02/07: Trading Lessons (Chart)

The USD/BRL continues to trend lower and speculators who have been pursuing the downwards motion of the currency pair have hopefully profited as support levels prove vulnerable. The USD/BRL closed near the 5.4582 ratio yesterday. Lows produced on Tuesday tested the 5.4175 mark briefly before reversing higher. The bearish trend in the USD/BRL has taken

0
Would love your thoughts, please comment.x
()
x