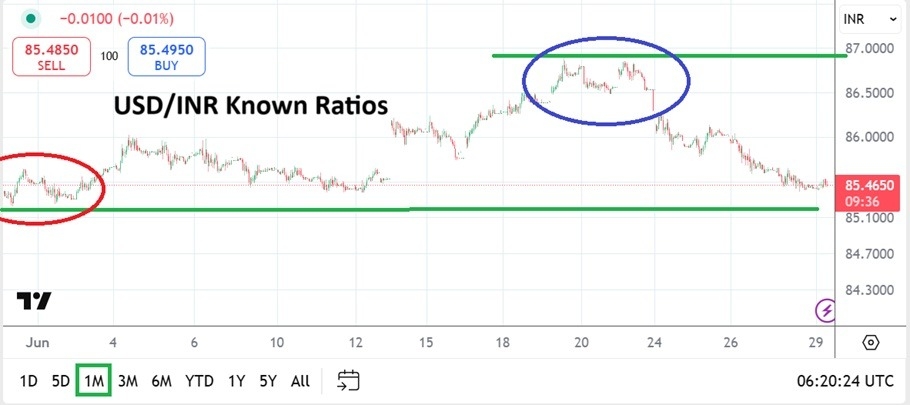
The USD/INR reacted with buying in the midst of the Middle East conflict which escalated two weeks ago, but since reaching highs near the 86.9600 vicinity the currency pair has returned to a known lower price realm.
The USD/INR appears ready to enter the month of July near values it began the month of June. If a trader somehow was not paying attention to global news and the Forex markets, they would assume everything has been calm and normal trading has been seen. However, the Middle East conflict between Iran and Israel that escalated on the 13th of June certainly caused widespread concerns, and India’s financial assets including the Indian Rupee were directedly effected.
The USD/INR had been trading near the 85.5300 ratio on the 12th of June, then as the war between Iran and Israel began to make news on the 13th, there was a gap higher and the 18.26000 realm was quickly hit. Financial institutions in India reacted quickly, but they also acted with an experienced hand, this because India has dealt with conflicts which have effected its marketplace through the decades. The USD/INR was simply correlating to risk adverse momentum in Forex and the currency pair touched highs as tensions in the Middle East built to within sight of 87.0000.
Important Notes on Highs in the USD/INR
However, while highs were quickly achieved in the USD/INR it is important to note that they did not touch realms in mid-February and March of this year. In fact the USD/INR in essence only tested highs seen in the second week of April when tariff rhetoric from the U.S White House was influencing Forex. It is also important to note the reversal lower which developed immediately upon the announcement of a ceasefire between Iran and Israel was very strong and also correlated to the broad Forex market.
By Tuesday of last week the USD/INR fell below the 86.0000 level and continued to incrementally sell off. The USD/INR is now within prices it literally started the month of June. The coming deadline of July 9th regarding tariff negotiations in the U.S will affect India, and financial institutions will be looking to define the results. For the moment, the USD/INR has returned to its well-practiced realms which have seen trading the past six months – yes, with ample tests higher and lower. But this notion is important too, because it highlights the Reserve Bank of India is balancing USD/INR values carefully.
Day Traders and the USD/INR
In order to trade the USD/INR for speculators it must be done outside of India. The currency market is tightly controlled in India and this is not going to change in the near future. Traders were certainly hit by massive volatility in the middle of June, but the USD/INR did correlate to the broad Forex market.
- The Reserve Bank of India which has a firm grasp on the value of the Indian Rupee will know before most others what should be expected via the tariff negotiations between the U.S and India.
- It appears for the moment the Reserve Bank of India is relatively calm.
- The U.S Federal Reserve seems to be in a position in which interest rates will need to be cut.
- But traders need to remember that outside influences regarding the value of the USD/INR do not always correlate.
USD/INR Outlook for July 2025
Speculative price range for USD/INR is 84.7500 to 86.1000
Traders of the USD/INR may want to look at charts from April and May to try and guess what could happen if U.S and India tariff negotiations have a good outcome in the second week of July. The 85.2500 mark was touched consistently in late April and throughout late May. The range of the USD/INR has the ability to move fast, but speculators need to understand compared to other major currencies the actual value changes via a percentage are far less than other major currencies.
Leverage is often used when speculating on the USD/INR and this is what causes large profit and big losses for Forex traders if they pursue the currency pair. The USD/INR appears to be correlating rather well to the broad Forex market in recent weeks and this will likely continue in July. The tariff negotiations between the U.S and India will certainly affect the currency pair too, and for the moment it appears institutions like the Reserve Bank of India are relatively calm.
Ready to trade our monthly forecast? Here’s a list of some of the top forex brokers in India to check out.


