USD/INR Forecast 12/06: USD Squeezes Higher (Chart)

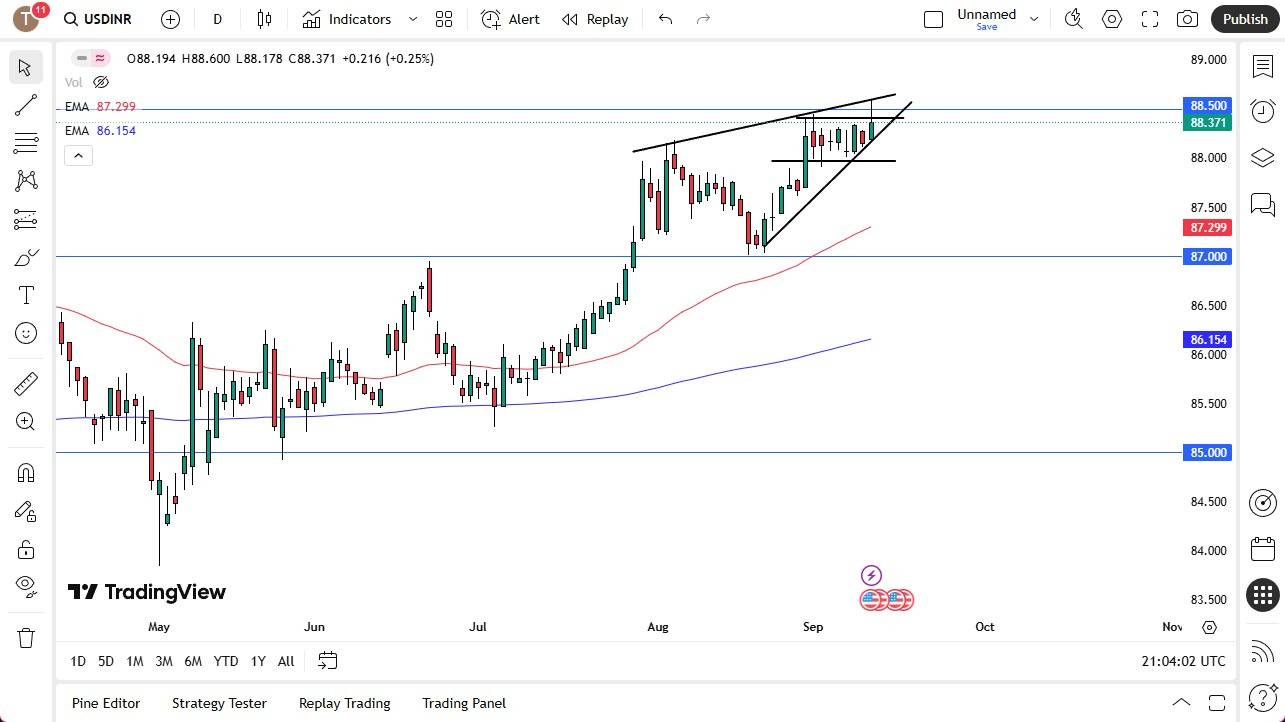
  • The trading session on Thursday have seen a bit of US dollar strength against the Indian rupee, as we briefly broke above the crucial ₹88.50 level.
  • This area has been a bit of a ceiling as of late, so it is an interesting area to pay close attention to.
  • With that in mind, it’s also worth noting that the pair seems to be forming a bit of a “rising wedge”, as well as sideways consolidation all at the same time.
  • In other words, it is obvious that a lot of pressure is building up in this pair, and it’s likely to see fairly significant moves somewhat soon.

USD/INR Forecast 12/09: USD Squeezes Higher (Chart)

Technical Analysis

The technical analysis for this pair is obviously very bullish, but we also have a lot to deal with in the form of the ₹88.50 level. The market has been rallying for quite some time, and as of late we have seen a little bit more chop, but while everybody else is selling the US dollar, traders of this currency pair may not be willing to do so as quickly, due to the fact that if there is a global slowdown coming, a lot of the emerging market economies will pay the price. Furthermore, you also have the situation where the Americans have levied heavy tariffs on India. Ultimately, there is a lot of noise.

Nonetheless, it’s worth noting that the 50 Day EMA is down at the ₹87.299 level and is rising. The ₹87 level underneath there should offer a certain amount of support as well, so all things being equal, this is a pair that even if we were to break down and fulfill the “rising wedge”, that’s probably as far as we go at the moment unless of course we get some type of massive “risk on” type of move around the world. I just don’t see that happening in this environment, and quite frankly it makes more sense that we eventually break the highs of the Thursday session and grind our way toward the ₹89 level.

Ready to trade our Forex daily analysis and predictions? Here are the best forex trading platforms in India to choose from.

Christopher Lewis has been trading Forex and has over 20 years experience in financial markets. Chris has been a regular contributor to Daily Forex since the early days of the site. He writes about Forex for several online publications, including FX Empire, Investing.com, and his own site, aptly named The Trader Guy. Chris favours technical analysis methods to identify his trades and likes to trade equity indices and commodities as well as Forex. He favours a longer-term trading style, and his trades often last for days or weeks.

Source link

Visited 1 times, 1 visit(s) today

Related Article

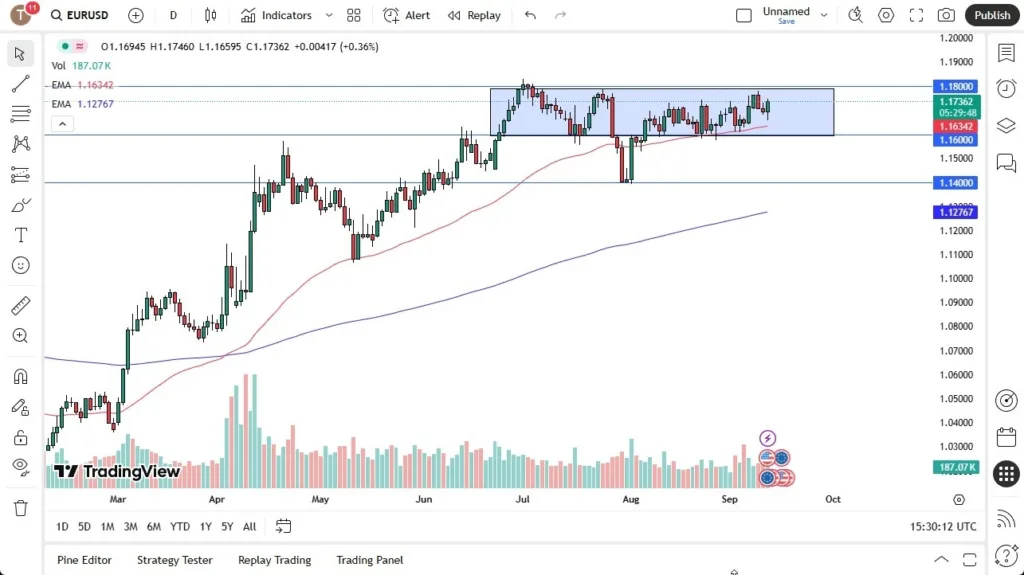
EUR/USD Forecast 12/09: Gains After ECB Meeting (Chart)

Gains After ECB Meeting (Chart)

Created on September 12, 2025 The Euro initially fell on Thursday but has turned around to show signs of life as the ECB meeting and the CPI numbers have come and gone. The ECB meeting was essentially what people expected, as the European Central Bank is going to hold rates, and will “watch the data.”

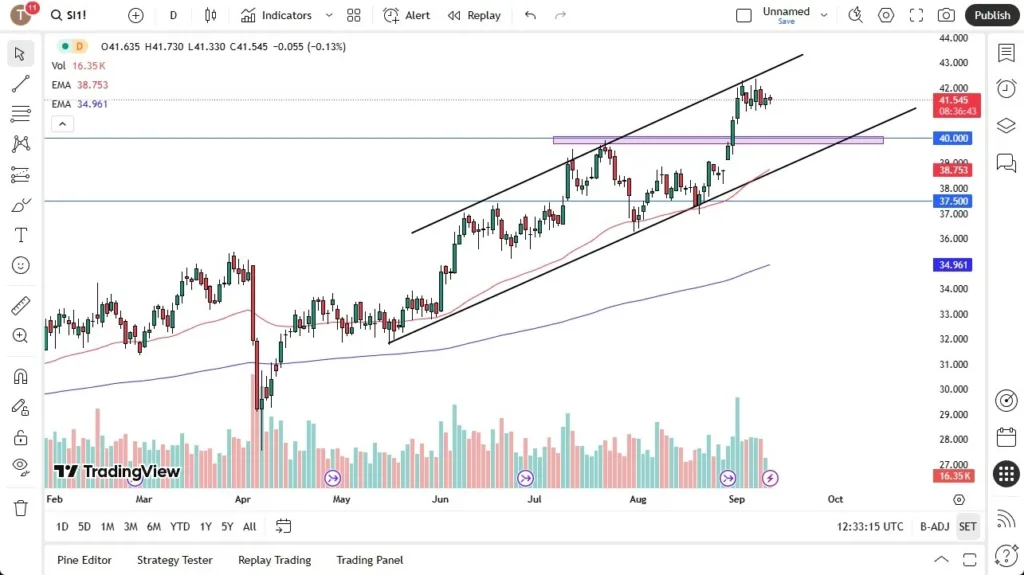
Silver Forex Signal 12/09: Work Off Momentum (graph)

Silver Forex Signal 12/09: Work Off Momentum (Video)

Created on September 12, 2025 Potential signal: I am buying silver if it reaches $42.60, with a stop loss at $42, and a target of $44.60 level. Silver has gone back and forth during the trading session here on Thursday in the early hours as we continue to see a lot of consolidation and absorption

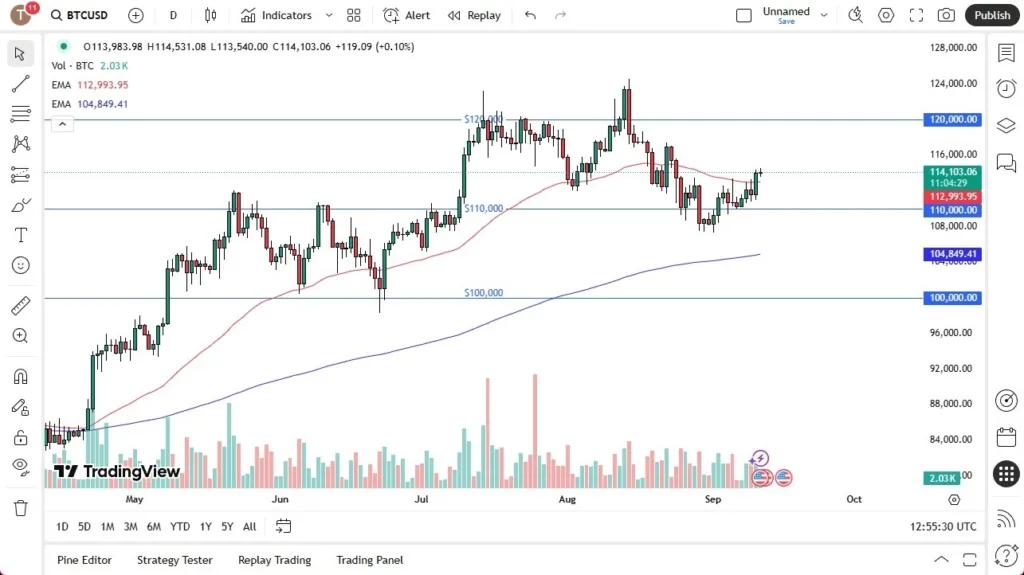
BTC/USD Forecast 12/09: Waiting for Momentum (Video)

BTC/USD Forecast 12/09: Waiting for Momentum (Video)

Created on September 12, 2025 Bitcoin has shown itself to be rather sideways and quiet during the trading session here on Thursday as we are sitting just above the crucial 50-day EMA and trying to absorb a lot of the bullish pressure that we had seen from the previous candlestick on Wednesday. At this point,

Attempts to Rally Early (Video)

Attempts to Rally Early (Video)

Created on September 12, 2025 The New Zealand dollar has shown itself to be a little bit resilient during the trading session on Thursday after forming a couple of shooting stars. This is a very interesting currency pair to me because it obviously represents risk appetite. But at the same time, we’ve recently seen the

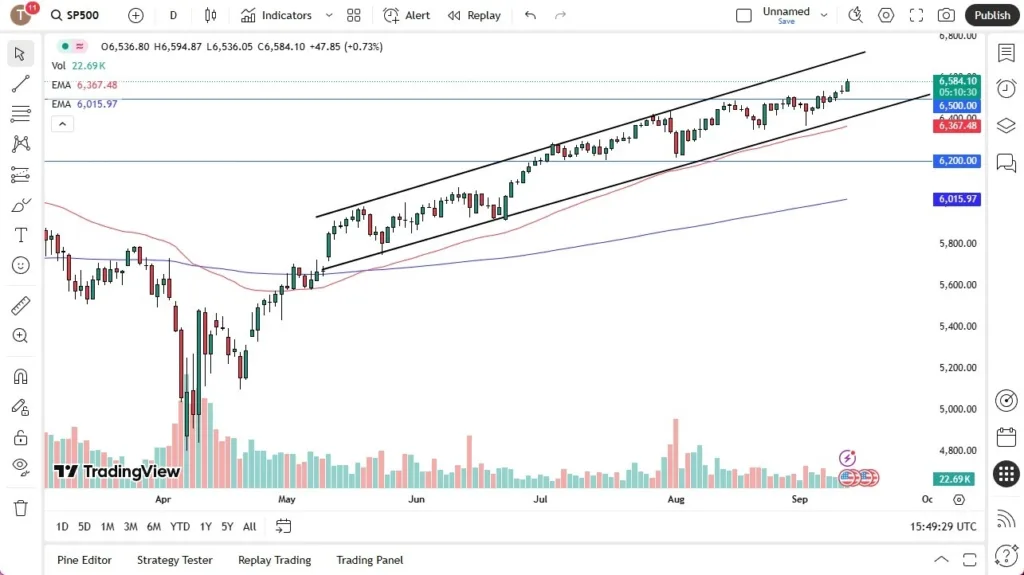
S&P 500 Forecast 12/09: Index Breaks Above 6580 (Chart)

Index Breaks Above 6580 (Chart)

Created on September 12, 2025 The S&P 500 rallied during the trading session on Thursday, breaking above the 6580 level rather quickly. That being said, the market is likely to continue to be very noisy, but I think given enough time we will continue to see buyers jumping into this market as Wall Street continues

over 90% of American investors wish to increase their allocation to Chinese assets.

On September 12, the Shanghai Composite Index broke through its previous high of 3,888.60 points during trading, setting a new phase high; the Shenzhen Component Index rose above the 13,000-point mark during trading, reaching its highest level since July 2022. Morgan Stanley noted that U.S. investors’ interest in Chinese equities has risen to its highest

China’s key stock benchmarks slumped more than 2 per cent on September 4, their biggest stumble in the current bull run. Photo: CFOTO/Future Publishing via Getty Images

China’s bull run tests regulators as Beijing aims to guide US$12 trillion stock market

Stunning gains in Chinese stocks are testing regulators’ ability to manage the ascent, as Beijing seeks to fulfil its long-standing goal of positioning the nation’s US$12 trillion equity market as a steady source of household income that can support consumer spending and economic growth. As the property market remains in the doldrums, eroding the wealth

The Emerging Ellison Empire

The Emerging Ellison Empire

Paramount Skydance chief executive David Ellison. (Photo by Charly Triballeau/AFP via Getty Images) On Thursday afternoon, the media world was jolted by a scoop from The Wall Street Journal: Paramount is preparing a majority cash bid for Warner Bros. Discovery, backed by the immense wealth of the Ellison family. The offer would cover the entire