Today’s Gold Analysis Overview:
- The overall of Gold Trend: Still bullish.
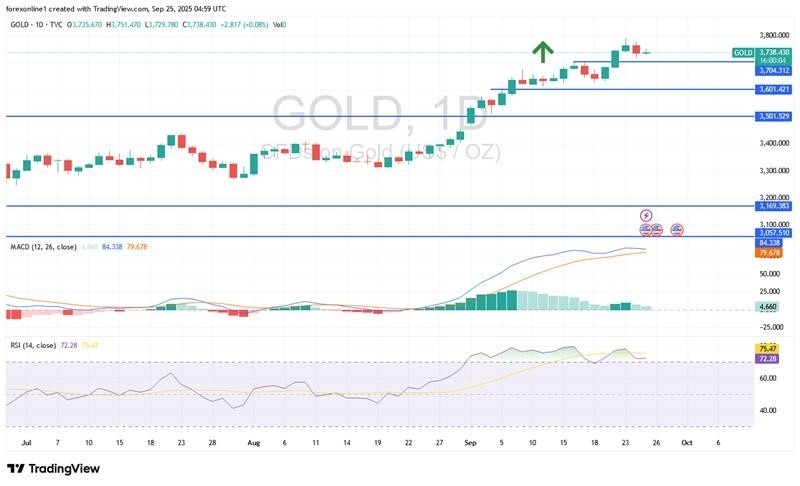
- Today’s Gold Support Levels: $3,710 – $3,660 – $3,590 per ounce.
- Today’s Gold Resistance Levels: $3,770 – $3,800 – $3,835 per ounce.
Today’s Gold Trading Signals:
- Sell gold from the $3,790 resistance level. Target: $3,600. Stop-loss: $3,830.
- Buy gold from the $3,650 support level. Target: $3,800. Stop-loss: $3,600.
Technical Analysis of Gold Price (XAU/USD) Today:
We have often warned that the gold trading market is vulnerable to profit-taking at any time following its consecutive historic gains. This occurred yesterday, as reported by gold trading platforms, when the gold index tumbled from the $3,780 per ounce resistance level, losing ground to $3,717 per ounce. This drop came shortly after the gold index had reached its all-time high of $3,792 per ounce this week. The rebound in the US dollar’s performance provided a clear opportunity for bears to push spot gold prices lower.
Yesterday’s session saw gold prices record their largest daily drop in both value and percentage since August 11, 2025. However, it was also the third-highest closing price in the history of the gold exchange. It’s worth noting that the index has risen by 41.95%, or $1,102.90, since the start of the year.
What’s happening in the gold market?
According to gold analysts’ forecasts and observations, market prices rarely move up or down in a straight line. Temporary fluctuations against the main trend are normal and healthy for the continuation of the overall trend. This week, both the gold and silver markets have seen strong upward breakouts on daily charts, indicating robust bullish momentum. The powerful surge in gold and silver prices seems to be accelerating recently, which could signal that the end of this current upward wave is approaching.
However, there is still significant room for gold and silver prices to rise in the near term before prices begin to decline. It is important to emphasize that market movement depends on several factors, including price and time. For example, the price of gold may reach $4,000 per ounce, but will this happen in two weeks, two months, or two years?
Despite the recent gold sell-off, the overall trend of the gold price index remains bullish, and the initial breakout of the bullish outlook, based on the daily chart, will not occur without the price of gold moving into the vicinity of and below $3,600 per ounce. The 14-day RSI and MACD remain in overbought territory. Overall, gold prices have declined, influenced by the stabilization of the US dollar after Federal Reserve Chairman Jerome Powell expressed a cautious stance on US interest rate cuts. However, gold prices remain close to their all-time highs, with traders continuing to anticipate two additional US interest rate cuts this year. Combined with the growing political and economic uncertainty, gold prices have strong upside potential.
A possible Fed rate cut is expected to support gold prices, reducing the opportunity cost of holding gold as a non-income investment. However, analysts believe the US Federal Reserve may not take as aggressive action as some investors and economists expect, given rising inflationary pressures.
Trading Tips:
We advise you to wait for further selling pressure before considering buying gold again.
Dollar Stabilizes Ahead of Key Data
According to forex currency market trades, the US Dollar Index (DXY), which measures the performance of the US currency against a basket of other major currencies, stabilized above 97.8 today, Thursday, September 25, 2025. This follows a sharp recovery in the previous session as traders await key employment and inflation data to shape their Federal Reserve policy expectations. The weekly jobless claims are due out later today amid rising concerns over a weakening labor market and increased layoffs, while Friday’s release of the Personal Consumption Expenditures (PCE) index will offer insight into the effect of tariffs on inflation.
Recent Fed statements have increased the ambiguity around rate-cut expectations, with financial markets no longer fully pricing in a cut next month. Futures contracts currently suggest an easing of 43 basis points across the Fed’s two remaining meetings this year. Uncertainty regarding a potential government shutdown has further added to market uncertainty.
Ready to trade our Gold forecast? We’ve shortlisted the most trusted Gold brokers in the industry for you.


