- The USD/CAD weekly forecast indicates likely pauses from the Fed and BoC.
- The dollar collapsed against most of its peers amid optimism about trade deals.
- Data revealed that US unemployment claims fell for the second week.
The USD/CAD weekly forecast indicates that traders are gearing up for a pause by the Fed and the Bank of Canada.
Ups and downs of USD/CAD
The USD/CAD price had a bearish week but closed well above its lows. At the start of the week, the dollar collapsed against most of its peers amid optimism about trade deals. A deal between the US and Japan assured investors that there might be more such deals before the August 1 deadline. As a result, risk appetite soared and the dollar fell.
-Are you looking for the best CFD broker? Check our detailed guide-
However, by Thursday, the focus shifted to monetary policy. Data revealed that US unemployment claims fell for the second week. As a result, Fed rate cut bets eased and the dollar rallied.
Next week’s key events for USD/CAD
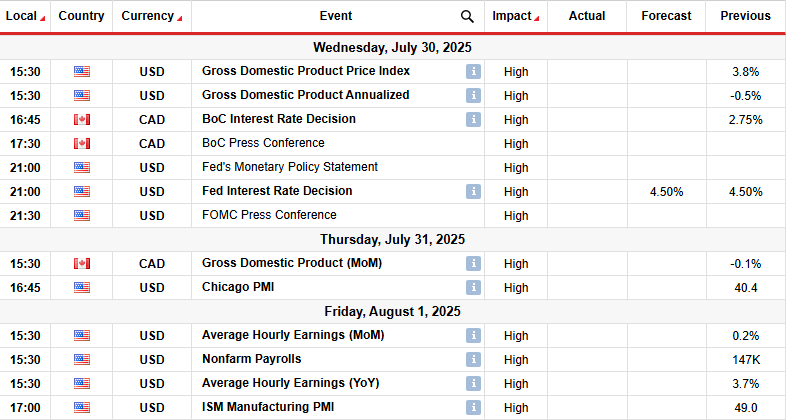
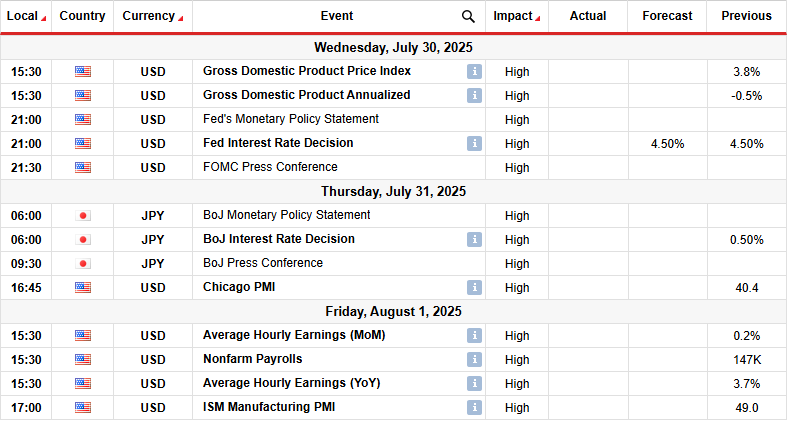
Next week, traders will focus on major economic events, including the US GDP, FOMC meeting, and the nonfarm payrolls report. Meanwhile, Canada will release its GDP report, and the Bank of Canada will also meet next week.
The most important events will be the policy meetings and the US employment report. The Fed will likely keep rates unchanged and maintain a cautious tone. The Bank of Canada will also continue its pause. Meanwhile, the NFP report will continue shaping the outlook for Fed rate cuts.
USD/CAD weekly technical forecast: Triple bottom, bullish divergence signal reversal
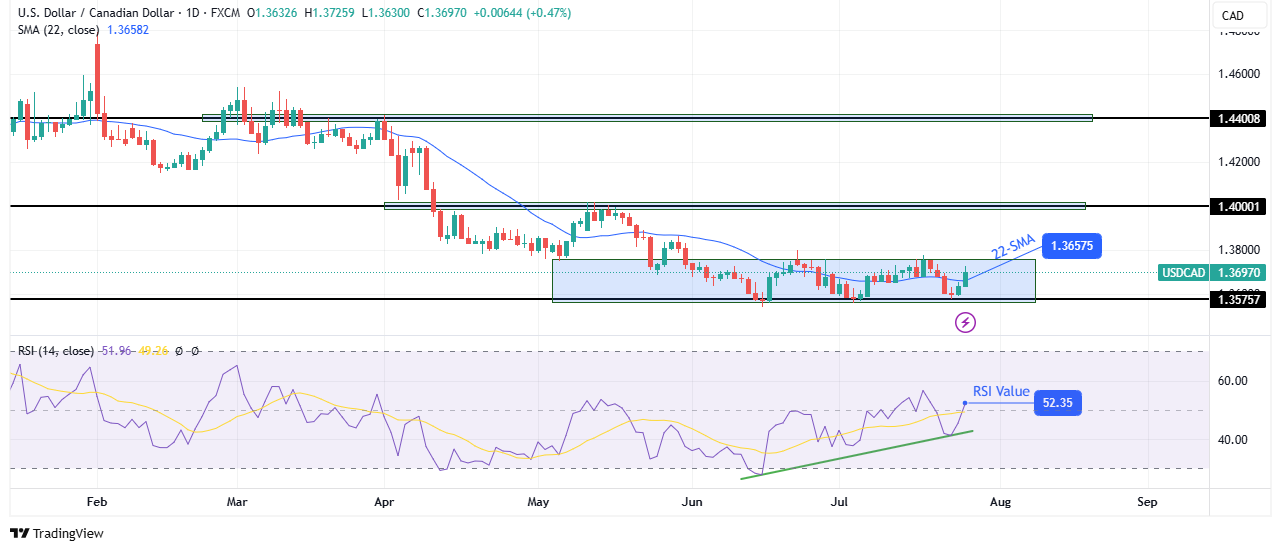
On the technical side, the USD/CAD price has broken above the 22-SMA, suggesting bulls are in the lead. At the same time, the RSI has broken above 50, suggesting stronger bullish momentum. However, the price remains in a tight range near the 1.3575 key support level.
-If you are interested in guaranteed stop-loss forex brokers, check our detailed guide-
On a larger scale, USD/CAD is trading in a corrective move after the downtrend paused near the 1.3575 support level. Initially, the price was making lower highs and lows until it reached the support level. Here, bears were unable to break below despite three attempts. As a result, the price has made a triple bottom.
Moreover, the RSI has made a bullish divergence, indicating weaker bearish momentum. This suggests that the 1.3575 level may mark a bottom for the downtrend. Moreover, bulls might soon break out of the tight consolidation to retest the 1.4000 key resistance level.
Looking to trade forex now? Invest at eToro!
68% of retail investor accounts lose money when trading CFDs with this provider. You should consider whether you can afford to take the high risk of losing your money.

![AI Day Trading - All You Need to Know–Updated [Year, Month]](https://koala-by.com/wp-content/uploads/2025/07/ai1.webp)