- The USD/CAD weekly forecast points to increasing economic concerns in Canada.
- Canada was one of the unlucky countries to fail to sign a trade deal with the US.
- Data revealed weak US job growth in July.
The USD/CAD weekly forecast points to increasing economic concerns in Canada after Trump imposed higher tariffs.
Ups and downs of USD/CAD
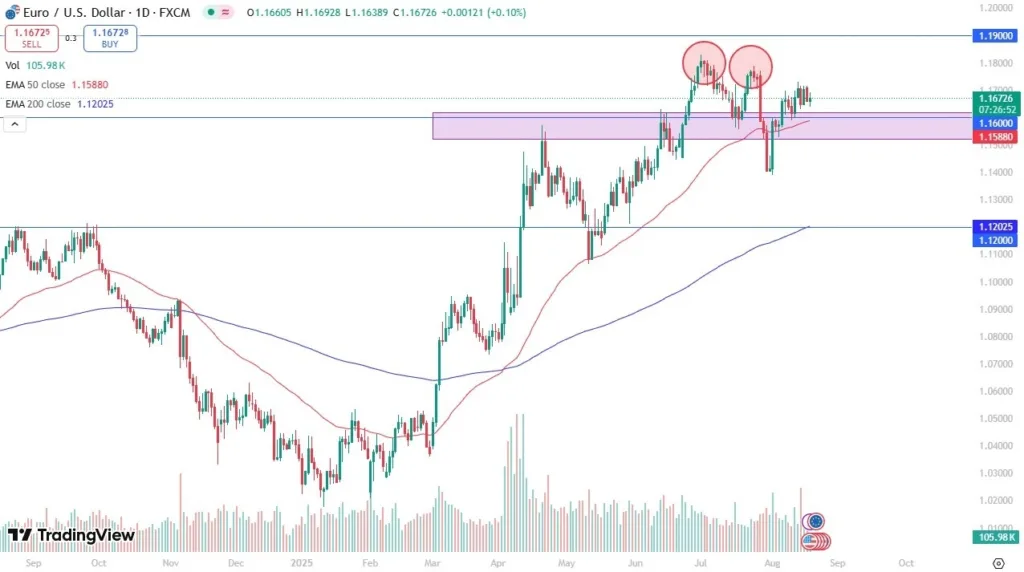
The USD/CAD pair had a bullish week as the loonie weakened amid tariff concerns. At the same time, the dollar gained against most of its peers, further weighing on Canada’s currency. Canada was one of the unlucky countries to fail to sign a trade deal with the US. As a result, tariff uncertainty weighed on the loonie until Trump announced a 35% tariff on Friday. Meanwhile, the tariff deadline boosted US Treasury yields and the dollar.
–Are you interested in learning more about Bitcoin price prediction? Check our detailed guide-
However, the Canadian dollar found some relief on Friday after data revealed weak US job growth and an increase in the unemployment rate.
Next week’s key events for USD/CAD
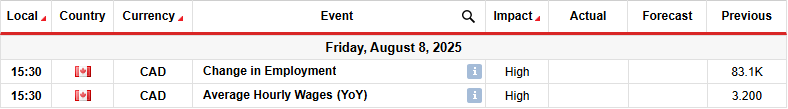
Next week, Canada will release its crucial monthly employment report. Recent data from the country has shown a recovery after the Bank of Canada lowered borrowing costs. This has allowed the central bank to pause for a while. Therefore, there is a chance that employment will remain robust.
However, Canada is now facing higher tariffs that might impact future economic growth. Therefore, traders will pay more attention to future reports.
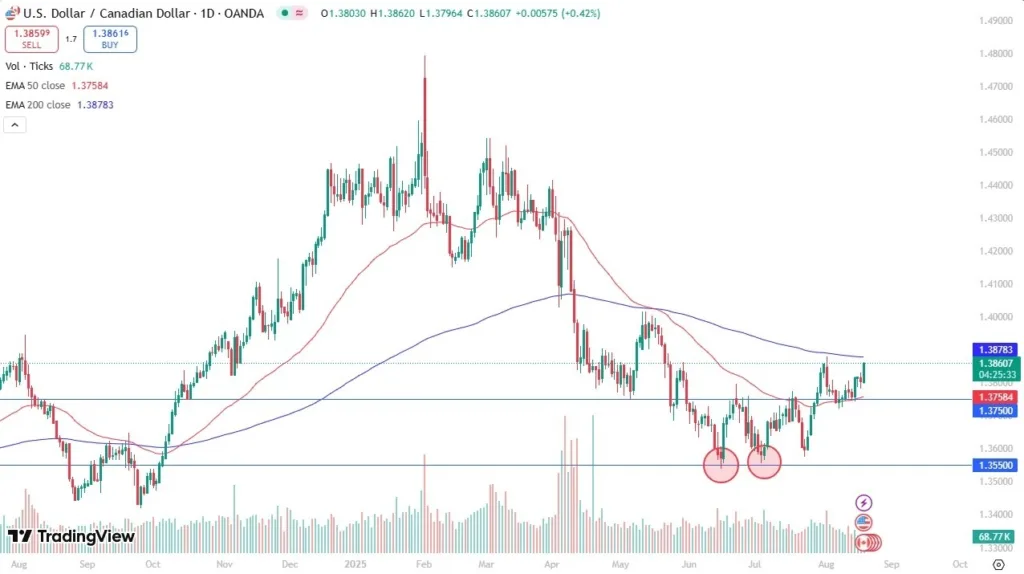
USD/CAD weekly technical forecast: Price retests 1.3750 after bullish breakout
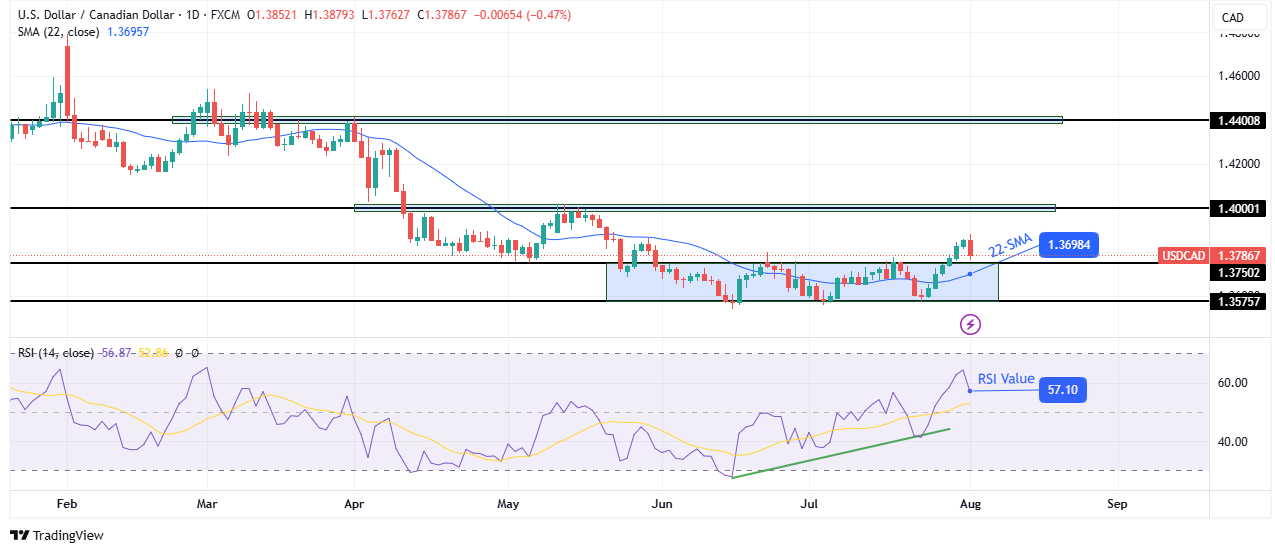
On the technical side, the USD/CAD price has pulled back to retest the recently broken 1.3750 key level. It trades above the 22-SMA, and the RSI is above 50, suggesting a bullish bias. Therefore, the retreat might only be brief before the bullish move continues.
–Are you interested in learning more about forex basics? Check our detailed guide-
The new direction comes after the price made a triple bottom near the 1.3575 key support level. Initially, USD/CAD was on a downtrend and had just made a new low. However, the price had stopped making significant swings from the SMA. Therefore, it remained in a tight range and could not break below 1.3575.
At the same time, the RSI made higher lows, indicating a bullish divergence. The divergence was a sign that bearish momentum was fading. As a result, bulls took over by breaking out of the tight range. If they remain in the lead, the price will likely retest the 1.4000 key psychological level.
Looking to trade forex now? Invest at eToro!
68% of retail investor accounts lose money when trading CFDs with this provider. You should consider whether you can afford to take the high risk of losing your money.