USD/CAD Weekly Forecast: Dovish Tilt Weighs on Greenback

  • The USD/CAD weekly forecast indicates a more dovish stance among Fed officials.
  • Fed’s Christopher Waller said he expects a cut in September.
  • Canada’s economy contracted by 0.1%.

The USD/CAD weekly forecast suggests a more dovish stance among Fed officials, which is weighing on the dollar.

Ups and downs of USD/CAD

The USD/CAD pair had a bearish week as the dollar fell amid increased expectations for a Fed rate cut. Fed officials sounded more dovish this week, increasing the chances that they will vote for a rate cut at the next meeting. John Williams said a rate cut is possible. Meanwhile, Christopher Waller said he expects a cut in September and more similar moves in the months ahead. However, he also noted that the outlook would depend on incoming data. 

Are you interested in learning more about forex indicators? Check our detailed guide-

Meanwhile, data on Friday revealed that Canada’s economy contracted by 0.1%, leading to a drop in the loonie.

Next week’s key events for USD/CAD

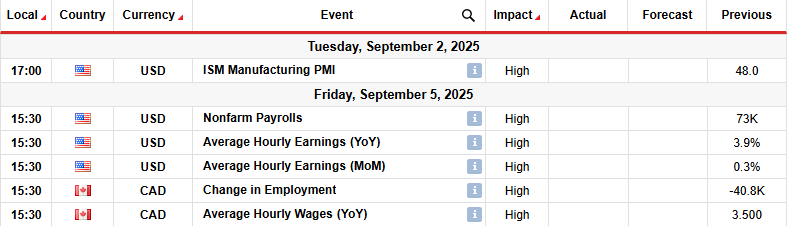
Next week, market participants will focus on business activity and employment data from the US. Canada will also release its crucial monthly employment figures.

The US nonfarm payrolls report will play a key role in shaping the outlook for Fed rate cuts. Further weakness in the labor market will solidify bets for a cut in September, weighing on the dollar.

USD/CAD weekly technical forecast: Bears face the 1.3750 level after SMA break

USD/CAD weekly technical forecastUSD/CAD weekly technical forecast

USD/CAD daily chart

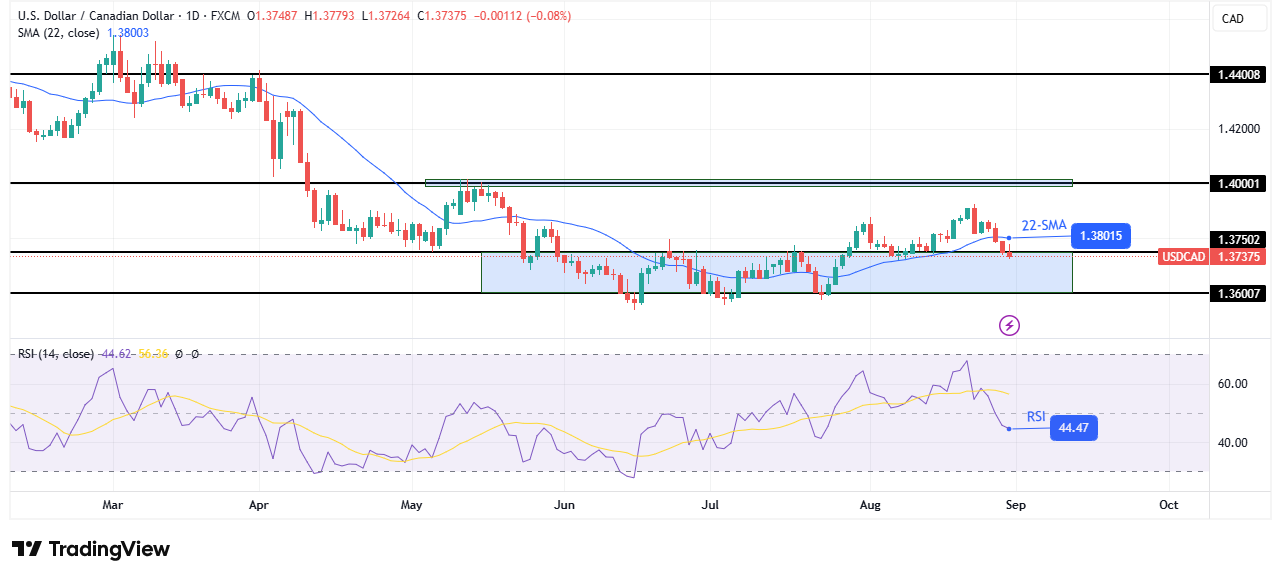
On the technical side, the USD/CAD price has broken below the 22-SMA, a sign that bears have taken the lead. At the same time, the RSI has broken below 50, indicating stronger bearish momentum. However, bears are facing the 1.3750 key level that might be difficult to break.

Are you interested in learning more about next cryptocurrency to explode? Check our detailed guide- 

Previously, the trend turned bullish after forming a triple bottom at the 1.3600 key level. The bulls broke above the 1.3750 level and respected the 22-SMA. Moreover, they made a higher high, confirming the start of a new trend. However, this changed when the price broke below the SMA. If this were just a deep pullback, bulls will likely return at the 1.3750 key level. This would allow the price to continue its new trend with a new high. It would also enable bulls to retest the 1.4000 key resistance level. 

On the other hand, if bears have taken over, the price will likely retest the 1.3600 support level. A break below would continue the previous downtrend. 

Looking to trade forex now? Invest at eToro!

68% of retail investor accounts lose money when trading CFDs with this provider. You should consider whether you can afford to take the high risk of losing your money.

Source link

Visited 1 times, 1 visit(s) today

Related Article

Jim Cramer Reveals Key Factor For AI Stock NVIDIA Corporation (NVDA) That No One’s Talking About

We recently published 9 Stocks On Jim Cramer’s Radar . NVIDIA Corporation (NASDAQ:NVDA) is one of the stocks Jim Cramer recently discussed. Jim Cramer Reveals Key Factor For AI Stock NVIDIA Corporation (NVDA) That No One’s Talking About Posonskyi Andrey/Shutterstock.com Cramer’s remarks about NVIDIA Corporation (NASDAQ:NVDA) were interesting since they were made before the firm’s second-quarter

Via Launches Initial Public Offering

NEW YORK, September 03, 2025–(BUSINESS WIRE)–Via Transportation, Inc. (“Via”), a leading provider of technology to power public transit networks, today announced the launch of its roadshow for the initial public offering of 10,714,285 shares of its Class A common stock. Via is offering 7,142,857 shares of Class A common stock and the selling stockholders are

Xcel Energy Fundamental Analysis Snapshot

Xcel Energy Signal 03/09: Follow the Breakdown (Chart)

Created on September 03, 2025 Short Trade Idea Enter your short position between $71.53 (yesterday’s intra-day low) and $72.91 (the lower band of its horizontal resistance zone). Market Index Analysis Xcel Energy (XEL) is a member of the NASDAQ 100 and the S&P 500. Both indices move away from all-time highs, as bearish pressures dominate.

Gold Forecast Today 03/09: Breaks Resistance (Chart)

Gold Forecast Today 03/09: Breaks Resistance (Chart)

Created on September 03, 2025 Gold markets continue to see a whole lot of buying pressure during the Tuesday session, as the futures market is threatening the $3600 level already. The size of the candle is very strong, not to mention the fact that there is a significant amount of volume for the session as

USD/CHF Forecast 03/09: Buyers Defend 0.80 Support (Chart)

Buyers Defend 0.80 Support (Chart)

Created on September 03, 2025 The US dollar has seen significant buying pressure during the trading session on Tuesday, not only against the Swiss franc, but multiple currencies around the world. That being said, in the USD/CHF pair, it looks as if the 0.80 level has offered enough of a reason to start buying again

Google Forecast 03/09: Gaps Lower to Start Week (Chart)

Gaps Lower to Start Week (Chart)

Created on September 03, 2025 Google (Alphabet) has seen a massive gap to kick off the trading week, as the market may have gotten a little bit too far ahead of itself. Wall Street overall looks rather poor during the trading session on Tuesday, and Google will be one of the biggest companies that people