The US Dollar starts the week on the defensive ahead of the release of the preliminary estimate of the annual revision of Nonfarm Payrolls (NFP) by the Bureau of Labor Statistics (BLS) on Tuesday, September 9 at 14:00 GMT.
The US Dollar Index (DXY) is trading around 97.60, down 0.16% for the day, reflecting traders’ cautious stance following a very soft August employment report (22,000 new jobs) and a rise in unemployment to 4.3%.
The markets have almost fully priced in a Federal Reserve (Fed) interest rate cut of 25 basis points (bp) on September 17, with a small probability of a further cut to 50 bps if the revision confirms a marked cooling in the labor market.
DXY technical analysis: Toward an acceleration to the downside?
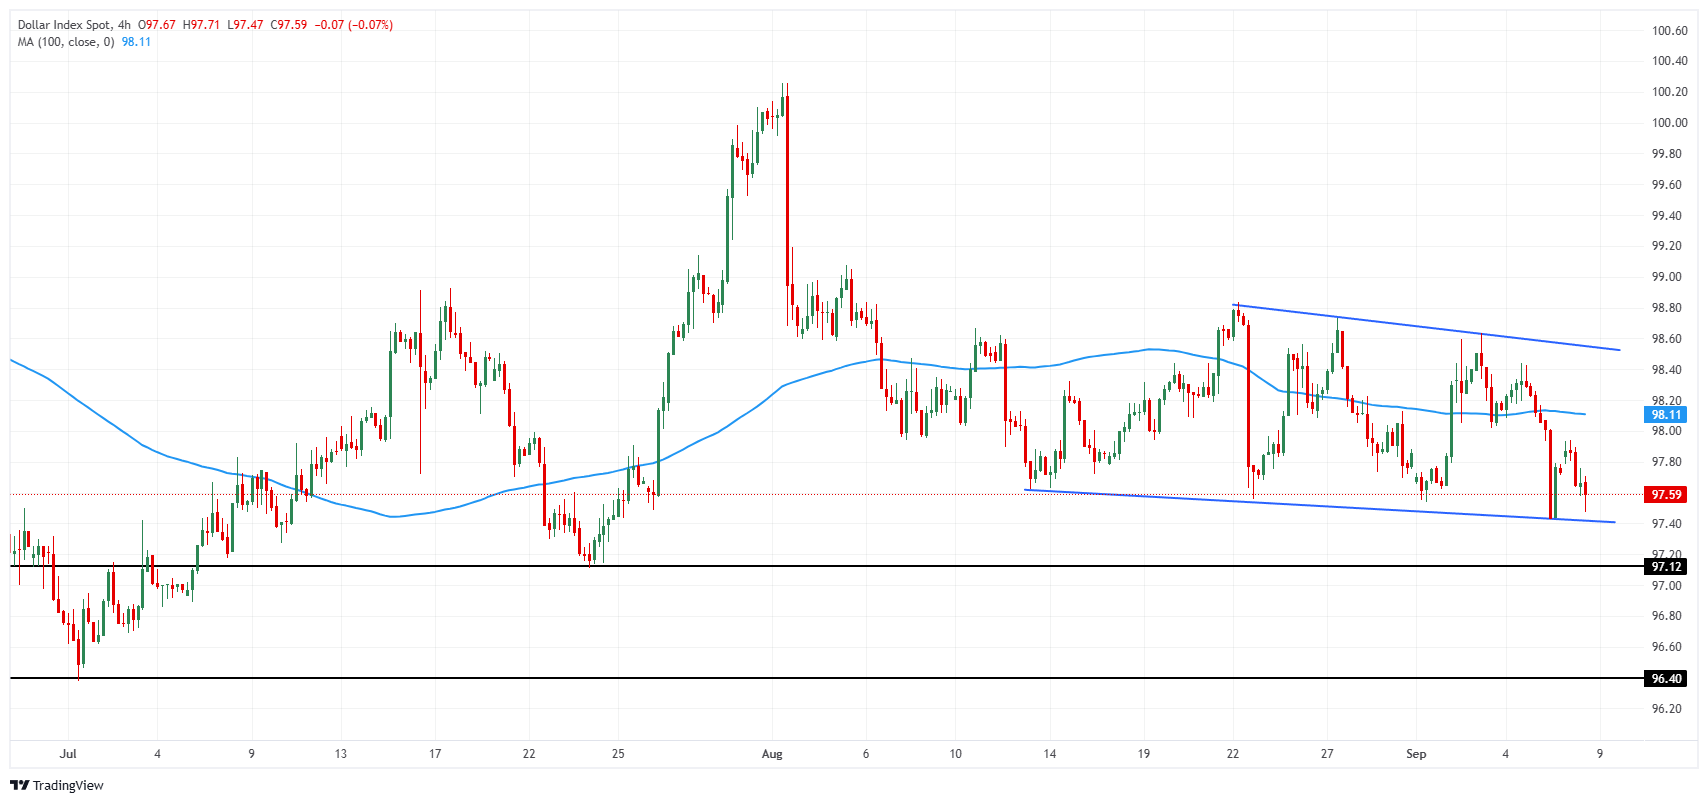
US Dollar Index 4-hour chart. Source: FXStreet.
The US Dollar Index has remained on a downtrend since peaking at 100.26 on August 1, and it is currently in a downtrend channel on the 4-hour chart as well.
The channel’s lower bound at 97.40 must be held to prevent the US Dollar from accelerating into a steep decline. If broken, the Greenback could fall toward the July 24 low of 97.11, before the July 1 low of 96.38.
Any DXY rebound must first confirm a break of the current bearish channel, whose upper bound is currently at 98.50, before considering a more significant short-term bullish reversal.
US Dollar Price Today
The table below shows the percentage change of US Dollar (USD) against listed major currencies today. US Dollar was the strongest against the Canadian Dollar.
| USD | EUR | GBP | JPY | CAD | AUD | NZD | CHF | |
|---|---|---|---|---|---|---|---|---|
| USD | -0.31% | -0.29% | -0.46% | -0.09% | -0.56% | -0.76% | -0.68% | |
| EUR | 0.31% | 0.02% | -0.05% | 0.22% | -0.23% | -0.40% | -0.35% | |
| GBP | 0.29% | -0.02% | -0.16% | 0.20% | -0.25% | -0.41% | -0.37% | |
| JPY | 0.46% | 0.05% | 0.16% | 0.29% | -0.13% | -0.45% | -0.19% | |
| CAD | 0.09% | -0.22% | -0.20% | -0.29% | -0.38% | -0.62% | -0.59% | |
| AUD | 0.56% | 0.23% | 0.25% | 0.13% | 0.38% | -0.16% | -0.12% | |
| NZD | 0.76% | 0.40% | 0.41% | 0.45% | 0.62% | 0.16% | 0.05% | |
| CHF | 0.68% | 0.35% | 0.37% | 0.19% | 0.59% | 0.12% | -0.05% |
The heat map shows percentage changes of major currencies against each other. The base currency is picked from the left column, while the quote currency is picked from the top row. For example, if you pick the US Dollar from the left column and move along the horizontal line to the Japanese Yen, the percentage change displayed in the box will represent USD (base)/JPY (quote).
The Nonfarm Payrolls Benchmark Revision expected to be lowered
Each year, the BLS “recalibrates” the establishment employment survey by aligning the March level with the Quarterly Census of Employment and Wages (QCEW), a quasi-exhaustive benchmark based on unemployment insurance returns.
Tuesday’s announcement will specify, on a preliminary basis, the size of the cumulative gap from April 2024 to March 2025. It will not immediately alter the official series (final integration at the beginning of 2026), but will guide the interpretation of past employment dynamics.
Several estimates converge toward a substantial negative revision. Fred Ashton of the American Action Forum puts forward a range of -470,000 to -740,000 jobs for the March 2025 level.
Seeking Alpha synthesizes forecasts from Wells Fargo (-475k to -790k) and Evercore ISI (-625k), while notes relayed by Wall Street CN give Nomura an estimate of -600k to -900k, or -50k to -75k per month on average.
Why it matters for the Fed and the USD
An aggressive revision would reinforce the idea that the slowdown in the labor market is more pronounced than indicated by the monthly releases. Standard Chartered believes that a “catch-up” of 50 basis points (bp) as early as September is plausible.
In the same vein, Fed Governor Chris Waller recently pointed out, according to Reuters, that once these revisions had been taken into account, private employment would probably have stagnated in recent months. Such a diagnosis would argue in favor of a weaker USD in the short term, particularly against the Euro (EUR), if inflation does not surprise on the upside.
The 2024 precedent and sector sensitivity
In August 2024, the preliminary estimate had cut the April 2023-March 2024 cumulative figure by 818,000 jobs, the biggest revision (as a % of the total) since 2009. Following this, the Fed cut interest rates at its September 2024 meeting.
If a similar pattern is confirmed, this could encourage analysts and traders to give greater consideration to the scenario of a 50 bps Fed cut as early as September, which would weigh on the US Dollar.