EUR/USD Analysis Summary Today
- Overall Trend: Preparing for an upward shift.
- Today’s EUR/USD Support Levels: 1.1600 – 1.1550 – 1.1470.
- Today’s EUR/USD Resistance Levels: 1.1700 – 1.1770 – 1.1860
")
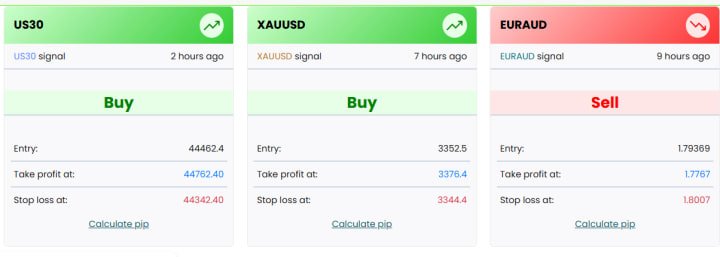
EUR/USD Trading Signals:
- Buy EUR/USD from the support level of 1.1560, with a target of 1.1900 and a stop loss of 1.1500.
- Sell EUR/USD from the resistance level of 1.1770, with a target of 1.1500 and a stop loss of 1.1810.
EUR/USD Technical Analysis Today:
The recent attempts by the EUR/USD pair to rebound upwards did not exceed the psychological resistance level of 1.1700. The pair may begin the new week stabilizing around 1.1640 and potentially trade within narrow ranges, as the economic calendar lacks significant and influential data from either the Eurozone or the United States. At the same time, the market may remain cautious, awaiting reactions to the upcoming US inflation figures later in the week, as well as the trajectory of tariffs imposed by the US administration on global economies, including the Eurozone.
Will the EUR/USD price rise to a high of 1.20 this week?
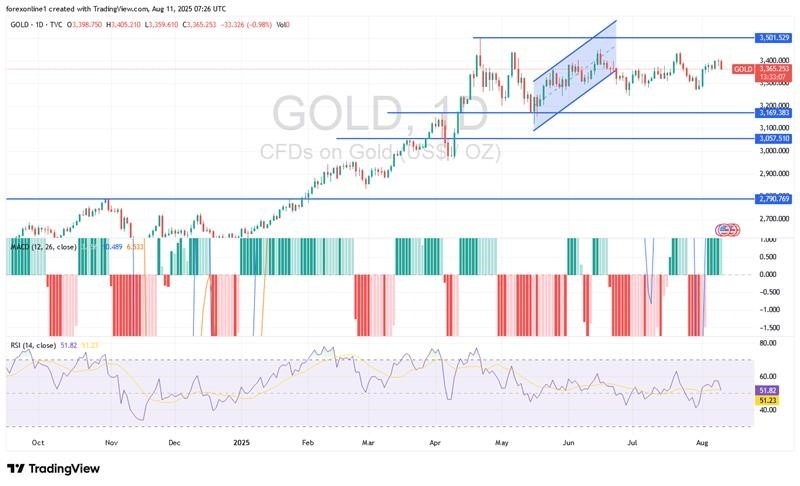
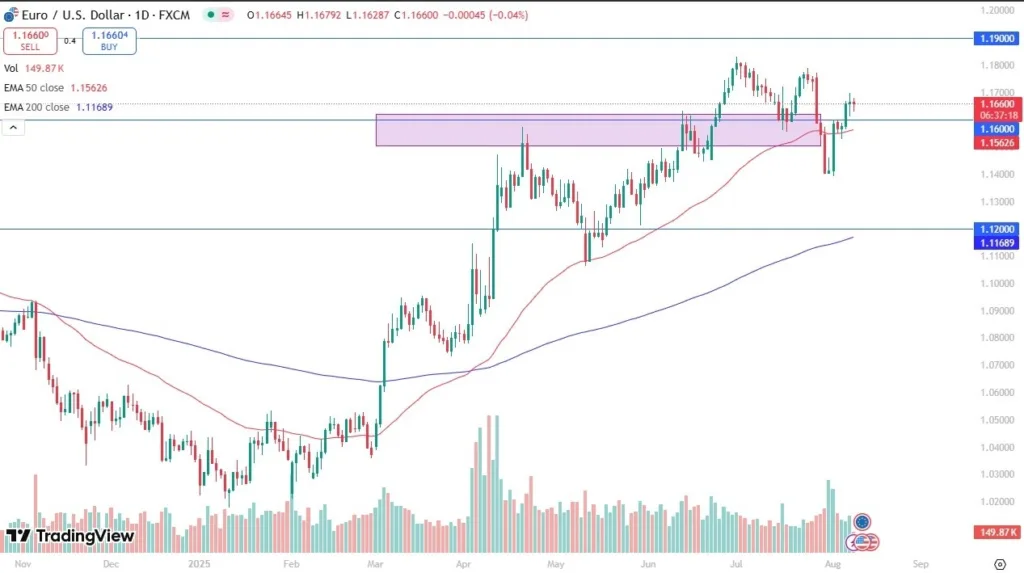
According to forex currency trading experts, the upward shift for the EUR/USD pair is still in its early stages. It could reach the psychological resistance of 1.2000 if it first surpasses the 1.1820 resistance. According to the daily timeframe chart, the technical indicators are at the beginning of an upward turn. The 14-day RSI (Relative Strength Index) is around a reading of 52, not far from the neutral midline, which means the upward rebound is awaiting a stronger catalyst. At the same time, the MACD (Moving Average Convergence Divergence) lines are in a neutral zone so far.
A bearish scenario for the Euro/dollar could become stronger if the bears push the currency pair back to the vicinity of the 1.1550 and 1.1420 support levels respectively.
Trading Advice:
We advises traders to be cautious, not rush, and wait for stronger selling opportunities for the EUR/USD instead of moving in neutral territory.
Keep in mind that the EUR/USD pair began its upward movement last Friday after finding support at the 100-day moving average, which has formed a strong base for buyers. This momentum continued this week, with the EUR/USD pair breaking above the 200-hour moving average and the 38.2% retracement level (1.1558) of the decline from the July high. The uptrend continued, surpassing the 50% midpoint at 1.16010, confirming increasing bullish control.
Towards the end of last week’s trading, the EUR/USD pair peaked near the 1.1700 resistance level, a natural resistance level, before retreating to retest the 50% retracement level. Overall, buyers held onto this level, reinforcing the upside. While Friday’s high fell short of the previous session’s high, the higher low kept buyers in the market, setting the stage for a key test at the start of the new week’s trading.
Fed Official: Three Rate Cuts Are Needed from Now
Federal Reserve Governor Michelle Bowman called for a cut in US interest rates in September and two more by the end of the year. As is well known, Michelle Bowman is a member of the Board of Governors of the US Federal Reserve and a permanent vote on the Federal Open Market Committee (FOMC). Also, Bowman cited the collapse in the US labor market in her justification for calling for three interest rate cuts by the end of 2025. Moreover, the US nonfarm payrolls report for July showed significant downward revisions compared to previous months.
Recently, Bowman was speaking at a bankers’ conference in Colorado Springs on Saturday. She is expected to support three interest rate cuts during the remaining three meetings of the Federal Reserve this year. She stated in her remarks, “With economic growth slowing this year and signs of a less dynamic labor market, I believe it is appropriate to begin gradually shifting our moderately restrictive policy stance toward a neutral position.”
Ready to trade our daily Forex analysis? We’ve made this forex brokers list for you to check out.