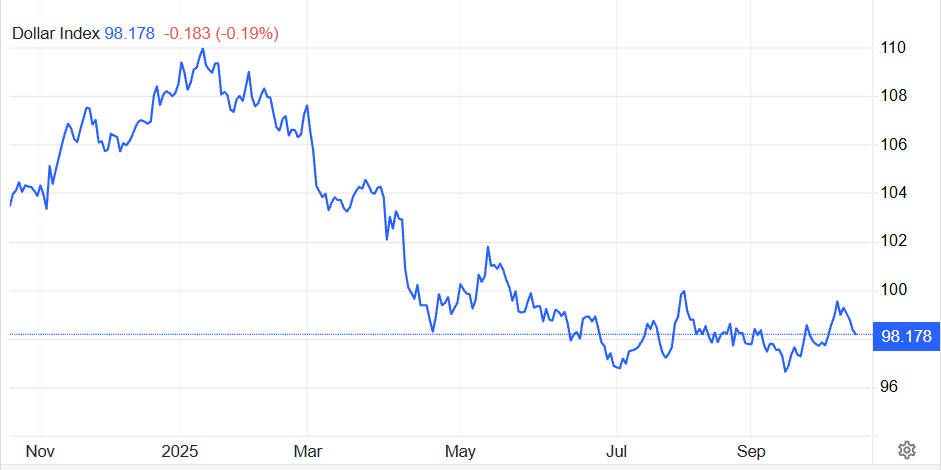
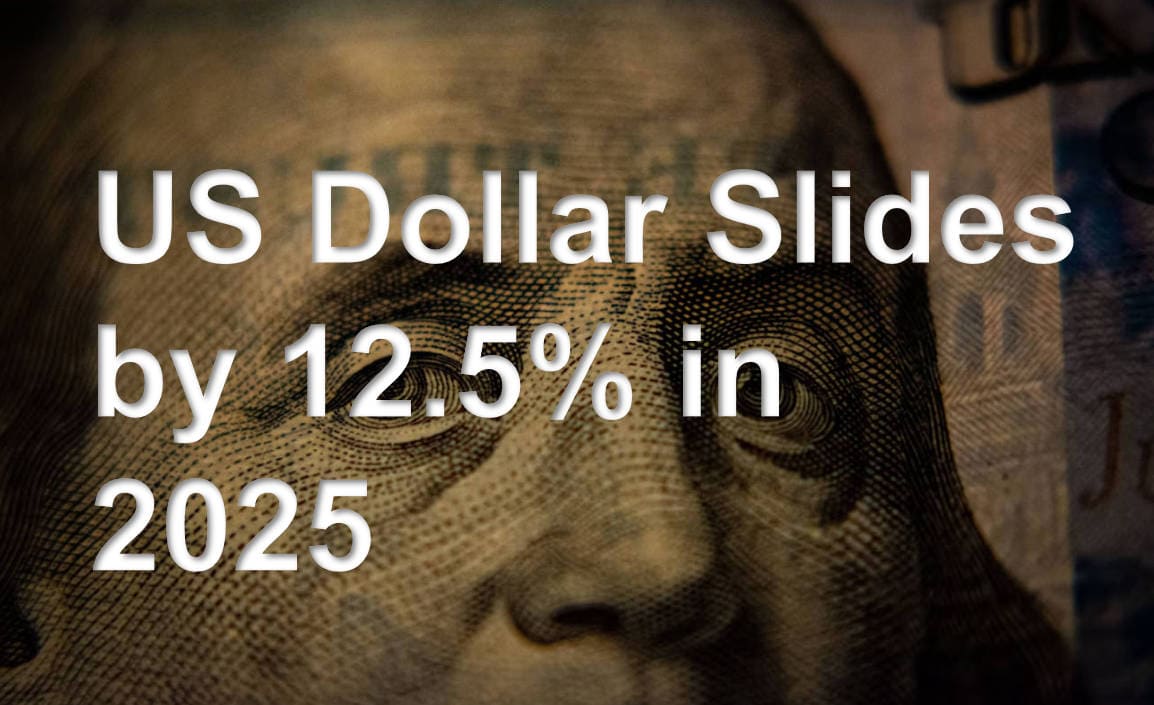
The US Dollar is undergoing its most punishing run in over two decades — a retreat of roughly 12–13% year-to-date that has seen the dollar index slip beneath the 100 mark and prompted fresh debate about whether a long-running dollar “supercycle” has turned.
Markets have rapidly repriced Federal Reserve policy, global growth differentials and safe-haven flows; the outcome will determine winners and losers across commodities, emerging markets and multinational earnings.
The dollar’s slide in context
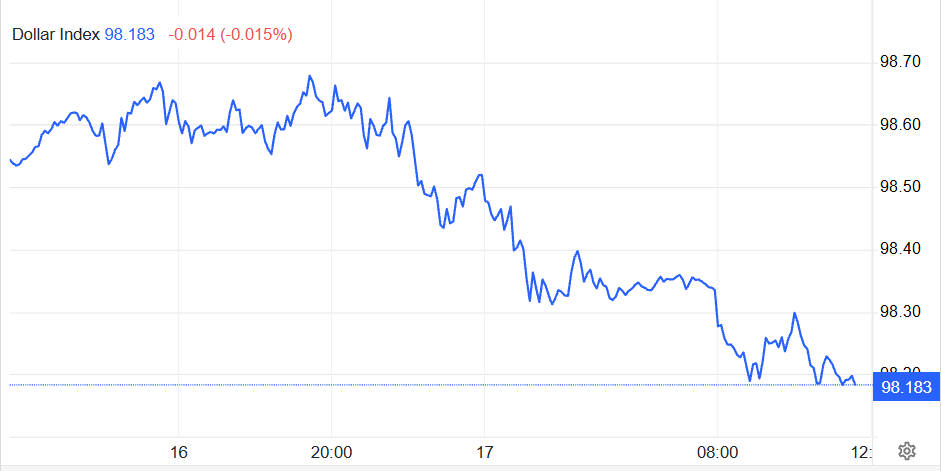
Since mid-January 2025 the US Dollar Index (DXY) has fallen sharply from its early-year highs; by 1 July it registered a low near 96.37 after trading above 110 in January. As of 17 October 2025 the DXY was trading around 98.2. underscoring that the earlier plunge has given way to a lower-for-longer trading range.
Three proximate drivers have dominated market attention: the Federal Reserve’s pivot from sustained tightening to the start of easing, the decline in short- and long-term Treasury yields, and a rotation of investor flows into safe assets such as gold amid geopolitical frictions.
| Indicator | Reading / implication |
|---|---|
| OECD PPP signals | Suggest the dollar was above PPP-implied fair value; models vary. |
| 10-yr vs 20-yr moving averages | Long-term moving averages remain useful trend anchors; monitor crossovers. |
| Fibonacci retracements | 38.2% ≈ high-90s; 50% ≈ low-90s; 61.8% ≈ high-80s — downside risk exists if easing accelerates. |
Why the dollar has weakened
1. Monetary-policy repricing.
Markets moved decisively after the Fed signalled a shift in stance: the 17 September FOMC statement and related communications crystallised expectations for rate cuts, reducing the dollar’s yield advantage versus other currencies and prompting a rapid rebalancing of FX positions.
2. Falling US yields.
Short- and long-dated Treasury yields have declined since mid-2025. The two-year yield, which closely tracks expectations for Fed policy, eased into the mid-3% area, while the 10-year traded near 4% — both softer than levels that supported the dollar earlier in the year. Lower yields reduce the carry benefit of dollar assets and make other currencies comparatively more attractive.
3. Flows into safe havens and geopolitics.
Heightened geopolitical tensions and credit-risk worries in October pushed investors towards gold and other safe havens even as the dollar weakened — a dynamic that can coexist when the dollar is no longer the sole haven of choice. Gold’s surge to record highs is a key symptom of that diversification.
Valuation and technical signals
Several valuation frameworks and technical measures now point to a dollar that is materially off its multi-decade highs but still above the longer-term averages preferred by some models.
1) Modelled overvaluation (PPP & moving averages).
Using purchasing-power-parity indicators and long moving averages as a guide — the OECD’s PPP series is the standard reference for cross-country price level comparisons — many analysts judge the dollar to have been elevated versus fair-value benchmarks for some time. Those models imply that a meaningful downshift in the DXY was plausible once policy differentials tightened.
2) Fibonacci and moving-average context.
Technical analysts point to key retracement levels: the 38.2% retracement of the rally from the crisis low sits near the high-90s, 50% retracement around the low-90s and 61.8% nearer the high-80s. Those bands define the scope for further downside if policy and growth differentiate further. (Editors: source exact DXY series for numeric precision.)
| Item | Latest (date-stamped) |
|---|---|
| US Dollar Index (DXY) | c. 98.24 (17 Oct 2025). |
| YTD change (approx.) | −12.5% from Jan 2025 high to Jul 2025 low. |
| Fed action (recent) | 17 Sep 2025 — FOMC moved to begin easing; statement and minutes published. |
| 2-year Treasury yield | ~3.42% (16–17 Oct 2025). |
| 10-year Treasury yield | ~3.97% (17 Oct 2025). |
| Gold (spot) | ~$4,300–$4,350/oz (mid-Oct 2025) — new record territory. |
What the change means — who wins, who loses
1. Commodities & exporters.
A weaker dollar lifts commodity prices in dollar terms and boosts competitiveness for exporters outside the United States. That dynamic has aided the meteoric rise in gold, with bullion hitting records in mid-October as investors hedge policy and geopolitical risk.
2. Emerging markets.
Softer dollar funding conditions reduce pressure on countries with large dollar-denominated liabilities; capital can re-enter EM assets, supporting local currencies and bond markets. That said, the benefits vary by balance-sheet strength and domestic policy.
3. Corporate earnings & trade.
US multinationals can see currency translation benefits on overseas sales, while importers may face narrower margins if costs fall less quickly than prices. FX hedging strategies will again matter for earnings season. (See later for action points for corporate treasuries.)
4. Fixed income & equities.
Lower yields generally support bond prices and can boost equity valuations; however, the macro outlook (growth, margins, inflation) will ultimately determine whether the rally is durable.
Three plausible scenarios for the dollar
-
Base case (40–50%): Gradual Fed easing across several meetings; DXY ranges 92–102 through 2026 as yields stabilise and spillovers are contained.
-
Deep-decline case (25–30%): Faster, larger easing and persistent global appetite for non-dollar assets drive DXY to the low-90s or high-80s (50–61.8% retracement).
-
Rebound case (20–30%): US growth surprises and/or Fed signalling a pause; yields pick up and the dollar rallies back above 100.
What reporters and market participants should watch next

-
US policy calendar: Fed speeches and the next FOMC meeting will re-set rate-cut expectations.
-
Key data prints: US CPI/PCE and payrolls — these will influence the Fed outlook and short-end yields.
-
Treasury yield behaviour: Moves in the 2- and 10-year will be tightly watched as proxies for policy and growth.
-
Gold and commodity flows: further price action will indicate where investors place their hedge bets.
Action points for practitioners
-
Revisit FX hedging horizons and the costs of rolling forward hedges.
-
Stress-test dollar-denominated liabilities under multiple DXY paths.
-
Monitor cross-currency basis and swap costs — liquidity shifts can be rapid.
Conclusion: a new equilibrium or a correction?
The data-driven conclusion is straightforward: markets have already priced a substantial reappraisal of US monetary policy and the relative attractiveness of dollar assets. Whether the current level marks a durable regime shift or the trough before another cycle depends on two interlinked variables — the path and credibility of Fed easing, and the evolution of global risk appetite.
Policymakers and market strategists will thus do well to treat the present episode not as a single event but as a process: watch the prints, watch the yields, and watch the flows.
Frequently Asked Questions
1. What is the US Dollar Index (DXY)?
The US Dollar Index (DXY) measures the dollar’s value against a basket of six major currencies. A higher DXY means a stronger dollar.
2. Why is the US Dollar weakening?
The dollar is weakening due to:
3. How has the Fed’s policy impacted the dollar?
The Fed’s shift to easing has reduced the dollar’s yield appeal, causing it to fall from 110 in January 2025 to around 98.2 in mid-October.
4. What’s the relationship between the US Dollar and gold?
The dollar and gold typically have an inverse relationship. As the dollar weakens, gold prices tend to rise as investors seek safer assets.
Disclaimer: This material is for general information purposes only and is not intended as (and should not be considered to be) financial, investment or other advice on which reliance should be placed. No opinion given in the material constitutes a recommendation by EBC or the author that any particular investment, security, transaction or investment strategy is suitable for any specific person.

