View the video of this post here.
Over the last 30 years, the purchasing power of the US Consumer Dollar has been cut in half due to inflation. At the same time, the S&P 500 has gained 888% (8% per year) AFTER adjusting for inflation. Why you need to invest, in one chart…

At Creative Planning, we’re proud to help clients experience a richer way to wealth in all 50 states and abroad, with over $390 billion in assets under management and advisement. So whether you’re in California, Texas, Florida, New York or any of the states in between, there’s an advisor right near you!
Receive a Free Wealth Path Analysis from a Creative Planning advisor today.
This is a special edition of the Week in Charts where I break down the state of the markets. Here’s a snapshot of what’s happening across the major asset classes and the economy…
📊 1) Stocks
In one of the most remarkable comebacks in history, the S&P 500 has now rallied 40% from the April lows, hitting 33 all-time highs on the year.


Corporate earnings have continued to climb, with S&P 500 profits projected to hit another new high in the third quarter, up 10% year-over-year (TTM).

But with stock prices up 17% in the past year, we are once again seeing multiple expansion. The price to peak earnings ratio for the S&P 500 has climbed to 27.9, over 60% above the historical median and at its highest level since 2000.

The S&P 500 is now trading at over 3.3x sales, its highest price to sales ratio in history.

Entering the year, US stocks had outperformed International stocks for over 16 years, by far the longest run of outperformance in history.

But so far this year, we’re seeing a reversal, with International stocks up 28% vs. a 14% gain for the S&P 500.

Within International, Europe has been the standout performer with the Eurozone ETF ($EZU) up over 35%.

Within the US equity market, we’re seeing a number of extremes:
- The ratio of Growth stocks to Value stocks is at a new all-time high, surpassing the dot-com bubble peak in March 2000.

- Tech sector outperformance is also at a new record high, above the peak from last year and March 2000.

- The ratio of US Large Caps to US Small Caps hit its highest level since April 1999 earlier this year. But over the past few months, we’ve seen a reversal in this ratio and Small Caps hitting their first all-time highs since 2021.


- Nvidia now makes up over 8% of the S&P 500, the largest ever for any single name in the index. Nvidia, Microsoft, and Apple now make up over 21% of the S&P 500, the highest weighting for any three stocks in the index on record. The 39% combined weighting of the 10 largest US stocks in the S&P 500 is also a record high.


💵 2) Bonds & the Fed
The US bond market is still working through its longest drawdown on record at 62 months and counting.

But after a 6% gain so far this year, it’s now just 3% away from hitting a new all-time high…

All of the major bond categories are now in positive territory on the year, with Emerging Markets leading the way.

Falling interest rates have helped to boost bond returns, with investors betting on a continuation of the Fed easing cycle that began in September 2024. The market is currently expecting (>99% probability) the Fed to cut rates again this month with a 25 bps move down to 3.75-4.00%. After that, 4 more cuts are priced in with the Fed Funds Rate expected to move below 3% by the end of 2026.

What could derail those expectations? A rise in the Fed’s preferred measure of inflation (core PCE) which at 2.9% remains well above the Fed’s 2% target.

What could accelerate those rate cuts?
Deterioration in economic conditions, particularly weakness in the labor market. While the Unemployment Rate remains low at 4.3%, jobs growth is slowing (<1% YoY) and the last 4 months all saw fewer than 100k jobs created. Private payrolls (ADP) have also declined for 2 consecutive months for the first time since the 2020 recession.


🏠 3) Real Estate & Housing
While the S&P 500 has hit 90 all-time highs since the start of 2024, US Real Estate stocks ($IYR ETF) remain over 10% below their peak from early 2022.

This is, in part, a result of the decline in US commercial real estate prices which are still down 18% from their peak 2022 levels.

Due to persistent underperformance, the ratio of US Real Estate stocks to the S&P 500 is now at its lowest level since 2000.

Shifting to the residential housing market, affordability – or the lack thereof – continues to be the biggest story.
The median household income necessary to purchase the median priced home for sale in the US ($124k) is now 57% higher than the current median household income ($79k). This is the most unaffordable housing market in history.

How did we get here? Home prices increasing by more than double the increase wages over the last decade and mortgage rates more than doubling over the past few years.
But signs of a shift are brewing with active listings up 7% year-over-year.

And home sellers are now estimated to outnumber buyers by over 500k, the largest gap on record with data going back to 2013.

If this gap holds, price appreciation should continue to moderate. On that point, US home prices rose less than 2% over the past year, the slowest growth rate in two years.

And seven major cities have turned negative on a YoY basis, with that number expected to grow in the coming months.

Meanwhile, the rental market in the US continues to become more affordable, as high vacancy rates (7.1%) have put a lid on prices. Rents have now declined on a year-over-year basis for 28 consecutive months with median rents still below peak 2022 levels. Renting a home is cheaper than paying a mortgage in all 50 of the largest metros in the US.


🛢️💱 ₿ 4) Commodities, Currencies, and Crypto
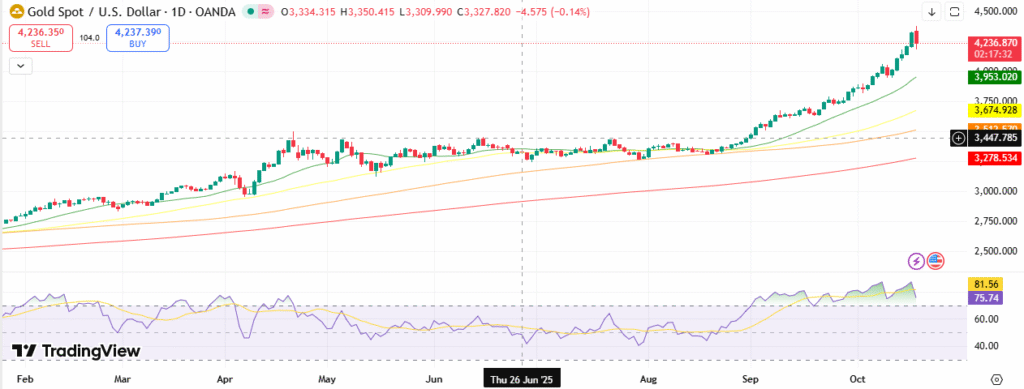
Gold has been the biggest story in Commodity markets this year, with a gain of over 65%. This is on pace for its best year since 1979.

Relative to inflation, Gold has never been higher than it is today, at 13x versus 9x at the peak in 1980.

Silver is also at a record high, leading all commodities in the past year with a gain of over 70%.

Bitcoin surpassed $126,000 earlier this month for the first time, its 18th $1,000-dollar milestone of the year.

Supporting the narrative behind both Bitcoin and Gold:
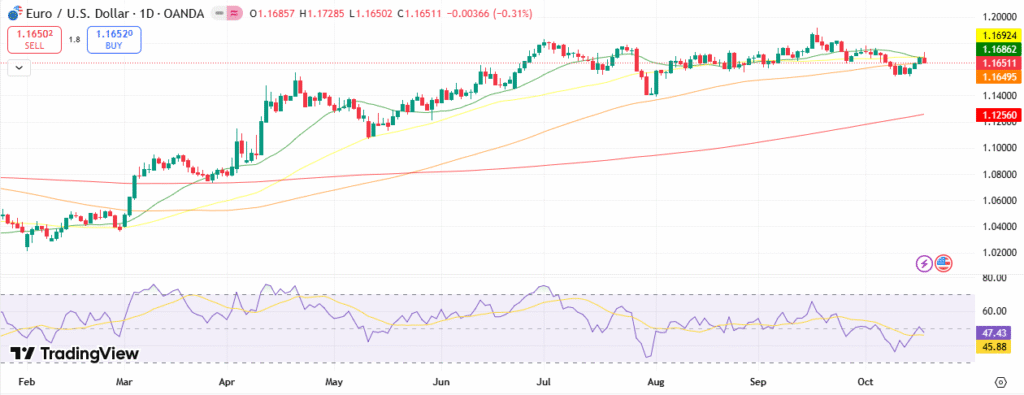
- The decline in the US Dollar Index, which suffered its worst first half of the year on record.

- The inability of the Federal government to reign in spending, with the budget deficit still running at close to $2 trillion and National Debt fast approaching $38 trillion.

- The resumption of Money Printing with M2 back at record highs, growing at its fastest pace in 3 years.

📉 5) The Economy
After falling 0.6% in Q1, real GDP snapped back in Q2, advancing 3.8%. This was driven by the reversal of the net exports category which was a big detractor in Q1 and a big contributor in Q2.


The US economy has now been in an expansion for over 5 years.

And the expansion is expected to continue for at least another quarter, with Q3 GDP tracking at +3.9% according to the latest estimate from the Atlanta Fed.

Robust consumer spending continues to drive economic growth, with the most important chart for the real economy moving in the right direction. Wages have now outpaced reported inflation on a YoY basis for 28 consecutive months, a great trend for the American worker that hopefully continues.

Every week I do a video breaking down the most important charts and themes in markets and investing. Subscribe to our YouTube channel HERE for the latest content.

Disclaimer: All information provided is for educational purposes only and does not constitute investment, legal or tax advice, or an offer to buy or sell any security. Read our full disclosures here.