Stuck in a Range (Chart)

Bullish view

  • Buy the AUD/USD pair and set a take-profit at 0.6600.
  • Add a stop-loss at 0.6400.
  • Timeline: 1-2 days.

Bearish view

  • Sell the AUD/USD pair and set a take-profit at 0.6400.
  • Add a stop-loss at 0.6600.

AUD/USD Forex Signal 18/08: Stuck in a Range (Chart)

The AUD/USD exchange rate was stuck at a key support level after the latest Australian jobs and United States consumer and producer inflation data. It was trading at 0.6500, a few points below last week’s high of 0.6570.

Australia Jobs and US Inflation Data

The AUD/USD pair moved sideways after Australia published a mixed jobs report last week. In a statement, the Australian Bureau of Statistics (ABS) showed that the economy created 24.5k jobs in July after adding 1,000 in the previous month.

The closely watched unemployment rate improved to 4.2% from 4.3% in the previous month, while the participation rate remained at 67% for the month.

These numbers came a week after the Reserve Bank of Australia (RBA) slashed interest rates by 25 basis points. Officials hinted that they will continue to review labor and inflation data to determine when to cut rates.

The AUD/USD pair reacted to the latest US consumer and producer inflation data, which showed that tariffs were having an impact on prices.

The data showed that the headline consumer price index remained at 2.7% in July, while the core inflation rose to 3.1% as it moved further away from the Fed target of 2.0%.

Another report showed that inflation expectations continued rising, leading to concerns on whether the Federal Reserve will start cutting interest rates in September, as analysts were expecting.

There will be no major economic data from the United States and Australia this week. Therefore, market participants will focus on Jerome Powell’s speech at the Jackson Hole Symposium on Friday.

Historically, the Fed uses this speech to set the tone on what to expect when the bank meets in the September meeting.

AUD/USD Technical Analysis

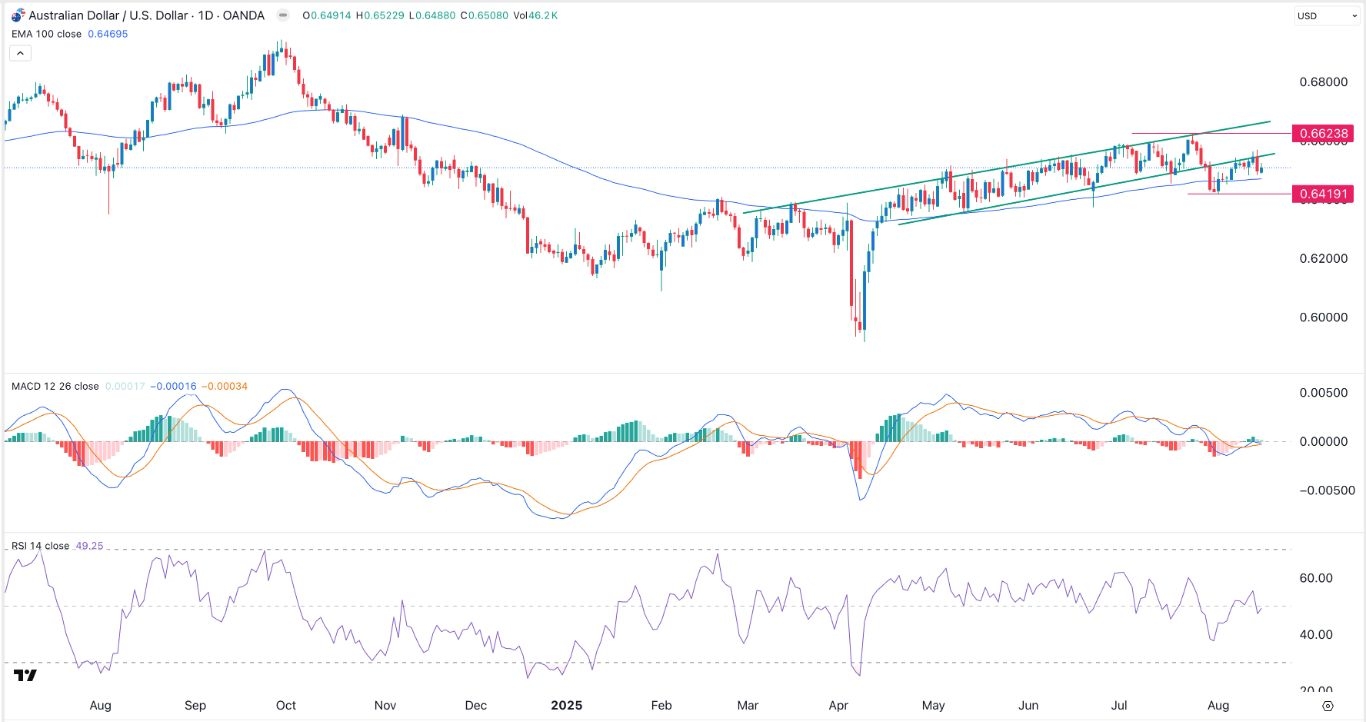
The daily timeframe chart shows that the AUD/USD exchange rate was trading at 0.6500 on Monday, up from this month’s low of 0.6420. It has retested the lower side of the ascending channel and moved above the 100-day Exponential Moving Average (EMA).

The Relative Strength Index (RSI) has remained at the neutral point at 50. Therefore, the pair is likely to remain within this range on Monday as traders await the Jackson Hole Symposium. The key support and resistance levels to watch will be at 0.6420 and 0.6600.

Ready to trade our free Forex signals? Here are the best forex platforms in Australia to choose from.

Crispus Nyaga is a financial analyst, coach, and trader with more than 8 years in the industry. He has worked for leading companies like ATFX, easyMarkets, and OctaFx. Further, he has published widely in platforms like SeekingAlpha, Investing Cube, Capital.com, and Invezz. In his free time, he likes watching golf and spending time with his wife and child.

Source link

Visited 1 times, 1 visit(s) today

Related Article

Stock Market Today: Nvidia Slides Despite Bullish Analyst Revisions

Stock Market Today: Nvidia Slides Despite Bullish Analyst Revisions

Nvidia(NASDAQ: NVDA) shares fell 3.5% on Tuesday, closing at $175.64, as tech stocks broadly pulled back following a recent rally. The chipmaker traded 183 million shares, just above its three-month average of 181 million, signaling a cooling of momentum after reaching record highs earlier this month. The broader markets reflected similar unease. The Nasdaq Composite

Viking Therapeutics stock crashes after weight-loss pill trial shows high dropout rate

Viking Therapeutics (VKTX) stock crashed more than 40% on Tuesday after a phase 2 trial of its weight-loss pill showed a high patient dropout rate. The company stated that most of the adverse treatment-related symptoms were gastrointestinal in nature, and 99% of the adverse events were mild. Over half (58%) of participants taking the drug

A chart line moving down over a hundred-dollar bill.

Why Palantir Stock Is Sinking Today

Geopolitical and macroeconomic dynamics appear to weighing on Palantir stock today. Palantir (PLTR -9.39%) stock is under pressure and getting hit with substantial sell-offs in Tuesday’s trading. The artificial intelligence (AI) leader’s share price was down 5.6% as of noon ET. At the same point in the day’s trading, the S&P 500 was down 0.4%,

COIN, MSTR, CRCL: Crypto Stocks Fall Alongside Bitcoin and Ethereum

COIN, MSTR, CRCL: Crypto Stocks Fall Alongside Bitcoin and Ethereum

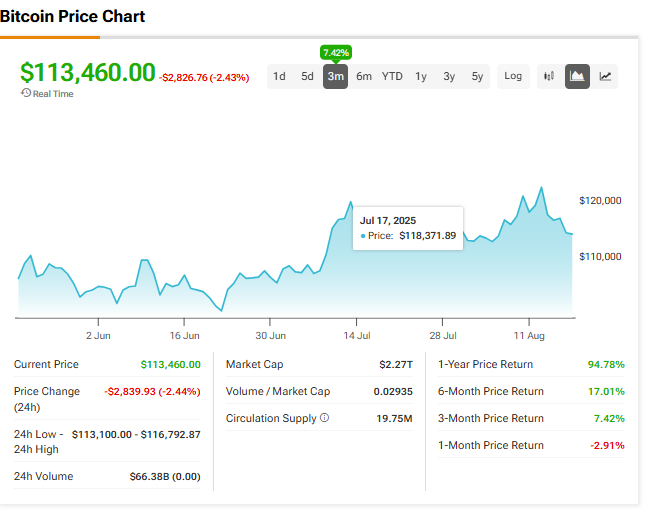
Leading cryptocurrency stocks are sliding lower alongside major digital assets such as Bitcoin (BTC) and Ethereum (ETH). Elevate Your Investing Strategy: Take advantage of TipRanks Premium at 50% off! Unlock powerful investing tools, advanced data, and expert analyst insights to help you invest with confidence. Crypto stocks that are down 5% or more on Aug.

What to know about Palantir's engineer-led sales strategy

Palantir stock slumps 9%, falling for a fifth straight day from record

CEO of Palantir Technologies Alex Karp attends the Pennsylvania Energy and Innovation Summit on the campus of Carnegie Mellon University in Pittsburgh, Pennsylvania on July 15, 2025. Andrew Caballero-reynolds | Afp | Getty Images Palantir‘s stock slumped more than 9% on Tuesday, falling for a fifth straight day to continue its pullback from all-time highs.

Microsoft and Nvidia dip while Tesla and Walmart shine — TradingView News

Microsoft and Nvidia dip while Tesla and Walmart shine — TradingView News

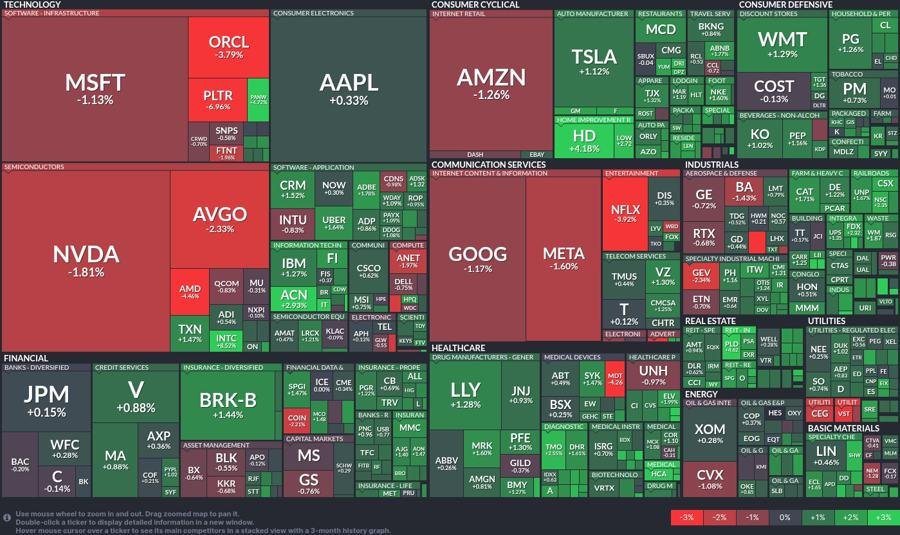
Stock heatmap by FinViz.com Tue, 19 Aug 2025 14:46:08 GMT Sector Overview The tech sector faces challenges today, with major players experiencing declines. The heatmap depicts a troubling landscape for technology stocks, highlighting a particularly rough day for semiconductor and software players. Microsoft (MSFT) is down by 1.13%, and Nvidia (NVDA) sees a fall of 1.81%,

Warren Buffett Cashing in Stocks to Prepare for Slump: Paul Dietrich

Warren Buffett Cashing in Stocks to Prepare for Slump: Paul Dietrich

Warren Buffett may be cashing in stocks because he sees a storm on the horizon — and could buy them back once prices tumble, a senior market strategist says. The “Oracle of Omaha” has a “history of selling out of the stock market” when economic and financial indicators are “signaling a bear market or a