Stock Market Today: Why Indexes Are Falling, Rally Is Stalling

The record-setting rally in stocks is stumbling this week.

US stocks dropped on Thursday as traders took in strong economic data, revised their expectations for Fed rate cuts, and took in wearing momentum in the AI trade. All three major US indexes slipped lower in the early morning, putting them on track for their third straight day of losses.

Here’s where US indexes stood at 11:15 a.m. ET on Thursday:

Here’s why the rally is taking a breather.

1. Bond yields are climbing

Bond yields rose on Thursday as the market took in two pieces of solid economic data:

  • The economy continues to grow. Real GDP rose 3.8% over the second-quarter, according to the latest estimates from the Bureau of Economic Analysis. That’s faster than the 3.3% growth rate that was previously estimated.
  • Fewer jobless claims. New applications for unemployment benefits eased to 218,000 in the last week, down from the 235,000 claims economists were expecting.

Both figures point to resilience in the economy. To investors, it’s a case of good-news-is-bad-news, as it could mean the Fed doesn’t have as much room to cut interest rates as previously thought.

The yield on the benchmark 10-year US Treasury inched up to around 4.18% on Thursday, up 18 basis points since it touched 4% earlier this month.

Rising bond yields hurt the appeal of stocks, as traders can park cash in a virtually risk-free asset at a relatively high yield.

The economic data has also slightly clouded the outlook for more rate cuts.

The odds that the Fed will hold rates steady at its upcoming policy meeting doubled from 8.1% on Wednesday to 16.6%, according to the CME FedWatch tool. Still, the consensus view of another 25 basis point cut at the October meeting is still largely intact.

“On the margin the stronger economic readings likely provide less cover for additional rate cuts,” Eric Teal, the CIIO at COmerica Wealth Management, wrote in a note.

2. AI fatigue


Nvidia CEO Jensen Huang holds GPU chips in his hands

JOSH EDELSON/Getty Images


After a fresh burst of optimism, the excitement around AI waned this week.

Oracle stock, which rose to a record high and saw its best-ever trading day after issuing colossal revenue guidance in its latest earnings, fell as much as 6% on Thursday. The stock is down 12% since Monday’s close.

Nvidia, the poster child of the AI boom, has also stumbled since it said it would invest $100 billion in OpenAI on Monday. The stock pared losses on Thursday to rise slightly by midmorning, but shares are down about 6% in three days.

“Investors trimmed their exposure to the artificial intelligence (AI) trade in a move which saw NVIDIA fall for a second day,” David Morrison, a senior market analyst at Trade Nation, said in a note about yesterday’s decline in the tech sector.

The exception is Intel, which is still seeing its stock climb after news that it was in talks with Apple for a potential investment. Shares rose 6%. It’s the latest positive catalyst for the stock since the company struck a deal with Nvidia last week.

Source link

Visited 1 times, 1 visit(s) today

Related Article

USD/ILS Analysis 25/09: Sideways Price Action (Chart)

USD/ILS Analysis 25/09: Sideways Price Action (Chart)

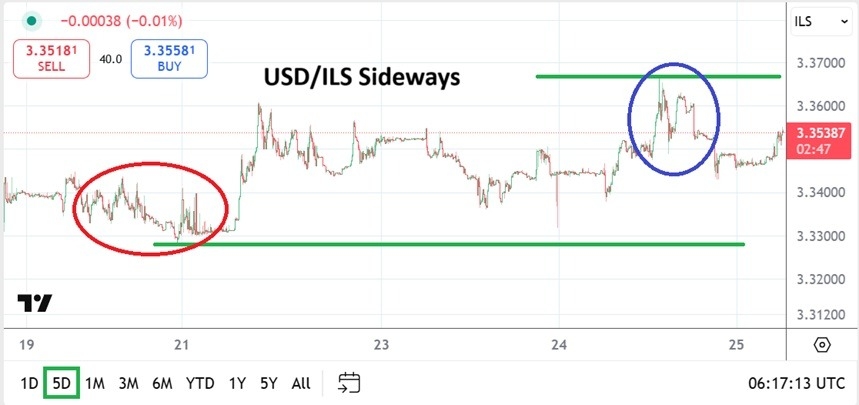
Created on September 25, 2025 The USD/ILS is near the 1.35440 mark as of this writing depending largely on a rather wide spread regarding bids and asks this morning, essentially providing sideways price action in a cautious Forex market. The value of the USD/ILS is around the 1.35440 vicinity this morning depending on the quote

EUR/USD Analysis 25/09: Renewed Selling Ahead (Chart)

EUR/USD Analysis 25/09: Renewed Selling Ahead (Chart)

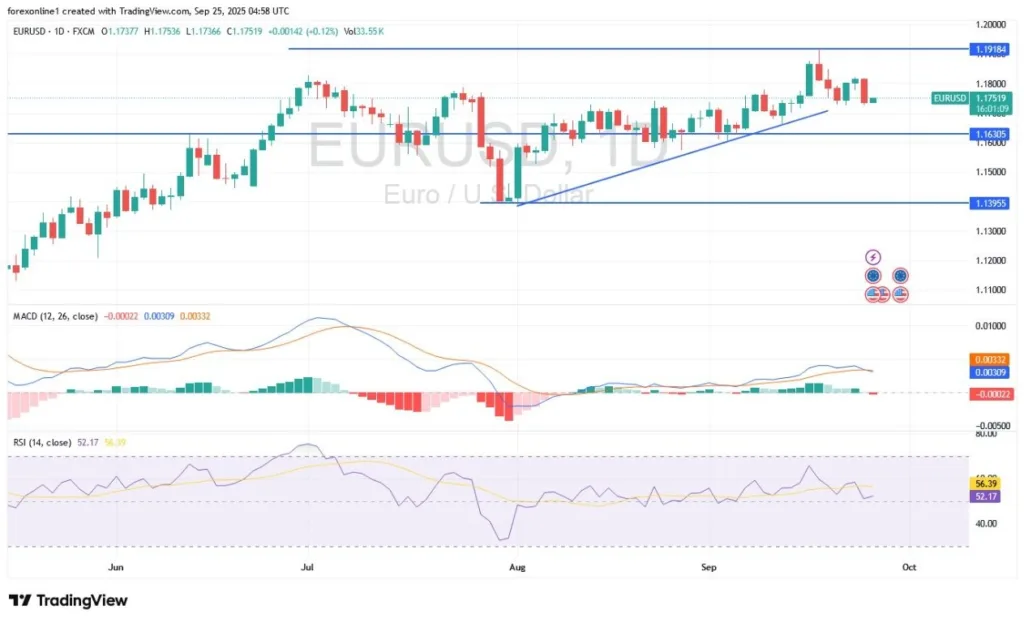
Created on September 25, 2025 EUR/USD Analysis Summary Today Overall Trend: Downward bias. Today’s Support Levels: 1.1720 – 1.1650 – 1.1580. Today’s Resistance Levels: 1.1800 – 1.1870 – 1.1930. EUR/USD Trading Signals: Sell EUR/USD from the 1.1820 resistance level. Target: 1.1600. Stop-loss: 1.1900. Buy EUR/USD from the 1.1640 support level. Target: 1.1810. Stop-loss: 1.1600. Technical

Gold Analysis 25/09: USD Gains Halt Gold's Rally (Chart)

USD Gains Halt Gold’s Rally (Chart)

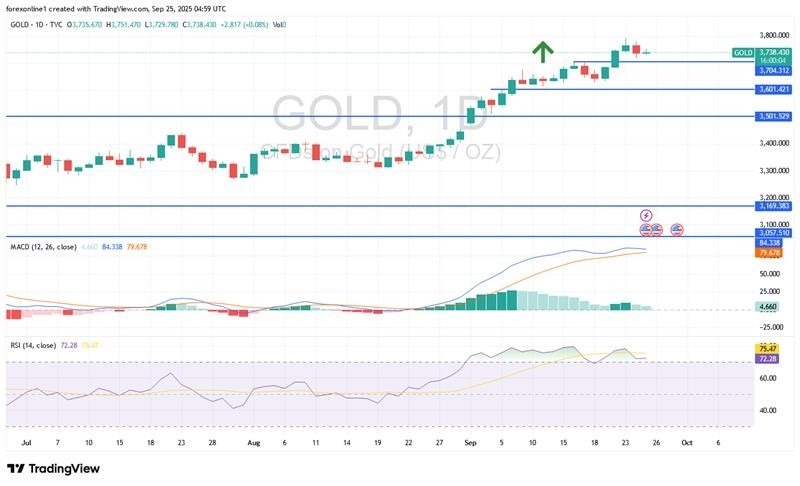
Created on September 25, 2025 Today’s Gold Analysis Overview: The overall of Gold Trend: Still bullish. Today’s Gold Support Levels: $3,710 – $3,660 – $3,590 per ounce. Today’s Gold Resistance Levels: $3,770 – $3,800 – $3,835 per ounce. Today’s Gold Trading Signals: Sell gold from the $3,790 resistance level. Target: $3,600. Stop-loss: $3,830. Buy gold

Alibaba Stock: Market Overestimating Market For AI Cloud (Downgrade) (NYSE:BABA)

Alibaba Stock: Market Overestimating Market For AI Cloud (Downgrade) (NYSE:BABA)

This article was written by Follow Julian Lin is a financial analyst. He finds undervalued companies with secular growth that appreciate over time. His approach is to look for companies with strong balance sheets and management teams in sectors with long growth runways. Julian is the leader of the investing group Best Of Breed Growth

Tradu launches expanded integration with TradingView

Tradu launches expanded integration with TradingView

London based multi-asset trading platform provider Tradu has announced expanded integration with social trading and charting platform TradingView, marking a major geographic and product expansion. This integration will enable traders to execute orders directly from TradingView’s world-class charting interface at no additional charges while benefiting from Tradu’s tight spreads, low commission and fast execution. Tradu

Pyth Network Unveils Institutional Market Data Service

Pyth Network Unveils Institutional Market Data Service

Categorised: Crypto, The Stream | Tags: crypto, equities, fixed income, FX, institutions, market data, Oyth Network, Pyth ProPosted by Colin Lambert. Last updated: September 25, 2025 Market data platform Pyth Network has launched Pyth Pro, something the firm says is a “next generation subscription service designed to deliver institutional-grade market data across cryptocurrencies, equities, fixed

Oklo Inc. (OKLO) Soared to a Record High This Week. Here is Why.

The share price of Oklo Inc. (NYSE:OKLO) surged by 48.86% between September 16 and September 23, 2025, putting it among the Energy Stocks that Gained the Most This Week. Oklo Inc. (OKLO) Soared to a Record High This Week. Here is Why. dan-meyers-xXbQIrWH2_A-unsplash Backed by OpenAI’s Sam Altman, Oklo Inc. (NYSE:OKLO) develops advanced fission power

Chinese Tech Stocks Advance, Set for Record Winning Streak

(Bloomberg) — Chinese tech stocks extended their rally Thursday, fueled by persistent investor enthusiasm for the country’s artificial intelligence developers. The Hang Seng Tech Index (HSTECH.HK) climbed as much as 2%, led by gains in JD.com Inc. (JD, 9618.HK), the e-commerce giant with ambitious AI plans, and smartphone maker Xiaomi (1810.HK, XIACF). The index, which