David Rosenberg isn’t always right. The founder of Rosenberg Research, who rose to fame after calling the 2008 recession, regularly expresses a bearish outlook for the economy and markets that often don’t come to fruition.
But in a world where bullish forecasts are the consensus among Wall Street’s top equity strategists, it can be prudent to heed Rosenberg’s warnings. While his predictions usually don’t play out, there’s no denying that the economist sufficiently shows his work, providing relevant data that ought to give investors pause.
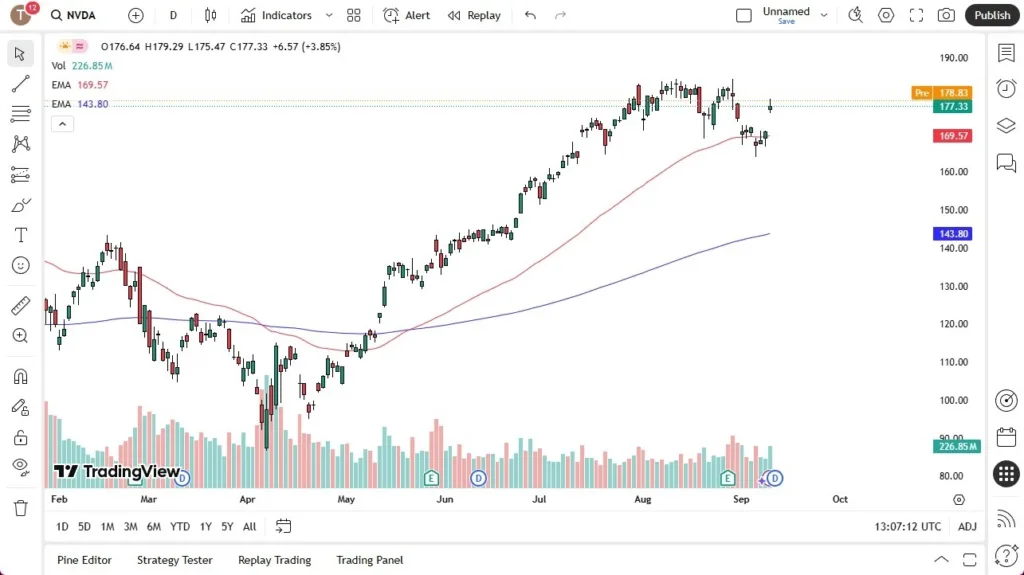
In a recent note to clients, Rosenberg provided some concerning numbers on where the S&P 500’s forward returns could be headed, given current valuations.
The index’s Shiller cyclically adjusted price-to-earnings ratio is hovering around 37.5. The measure smooths out business cycles by comparing current stock prices to a 10-year rolling average of earnings.
It’s the third-most expensive level of all-time, behind peaks in 2021 and 2022.
Rosenberg Research
Valuations are usually reliable predictors of long-term stock market performance. Bank of America data shows that starting valuations can explain about 80% of the market’s performance over the following 10 years. Last year, Morgan Stanley and Goldman Sachs strategists said that high valuations would lead to relatively weak returns for the market over the coming decade.
In the short term, valuations are poorer predictors of performance. Rosenberg’s data, however, shows that when the market gets this historically expensive — though, granted, it has only happened twice before — one-year forward returns have been negative.
The column on the right in the table below shows forward returns over 1-, 3-, 5-, and 10-year periods when the Shiller CAPE ratio gets above 35.
Rosenberg Research
“It’s the only cutoff point where every single time is negative,” Rosenberg said in an interview with Business Insider on Thursday.
Valuations alone aren’t why Rosenberg is skeptical of the rally. It’s the heightened expectations paired with a weakening economic backdrop as the labor market continues to show signs of slowing. Job growth has been below 100,000 per month over the past four months, data from the Bureau of Labor Statistics show. And the economy has added 911,000 fewer jobs than previously thought in the year through this March, the BLS said this week.
Related stories

Business Insider tells the innovative stories you want to know
Business Insider tells the innovative stories you want to know
Rosenberg believes the outlook will continue to worsen.
He pointed to initial jobless claims rising to 263,000 last week, worse than economists expected and at levels that should trigger downward pressure on payroll growth. All of this adds up to the US economy already being in the midst of or on the precipice of a downturn, he said.
“What we know arithmetically is that the hiring rate today is so low that once you cross above 240,000 on claims, it triggers a negative impulse on nonfarm payrolls, which I think is what we’re going to see when the September data roll out early October,” he said.
The fact that stocks continue to punch through all-time highs despite these warning signs — showing heightened investor sentiment — is one clue that stocks are in bubble territory, Rosenberg said.
“This is what a euphoric state looks like we’re seeing it in real time,” hea added. “We are in a gigantic price bubble that is ongoing. And you know it’s a price bubble when prices move up in the face of negative fundamentals.”