S&P 500 Flashes Golden Cross, a Bullish Signal for More Stock Gains

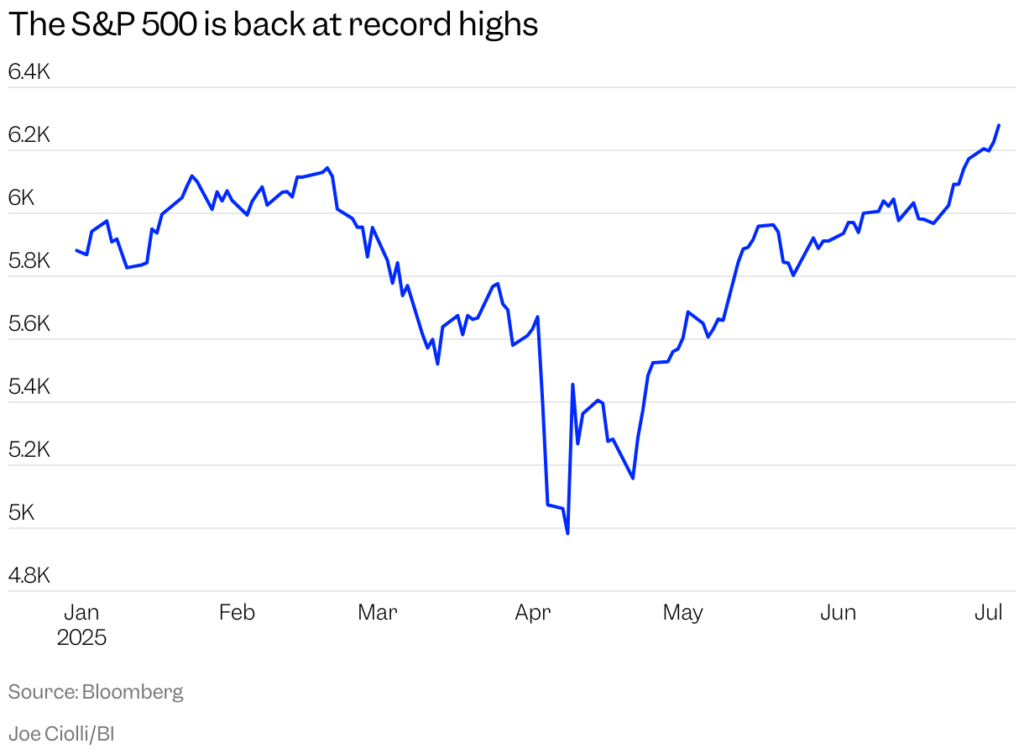
After hitting record highs in recent days, the S&P 500 just flashed an indicator for more gains ahead.

On Tuesday, the index’s 50-day moving average of 5,846.34 closed above its 200-day moving average of 5,837.96, a bullish technical pattern known as a golden cross.

It’s the first time the indicator has flashed since February 2023.

Historically, the golden cross has been seen 38 times in the S&P 500since World War II. In over 70% of these occurrences, the index has closed higher a year later.

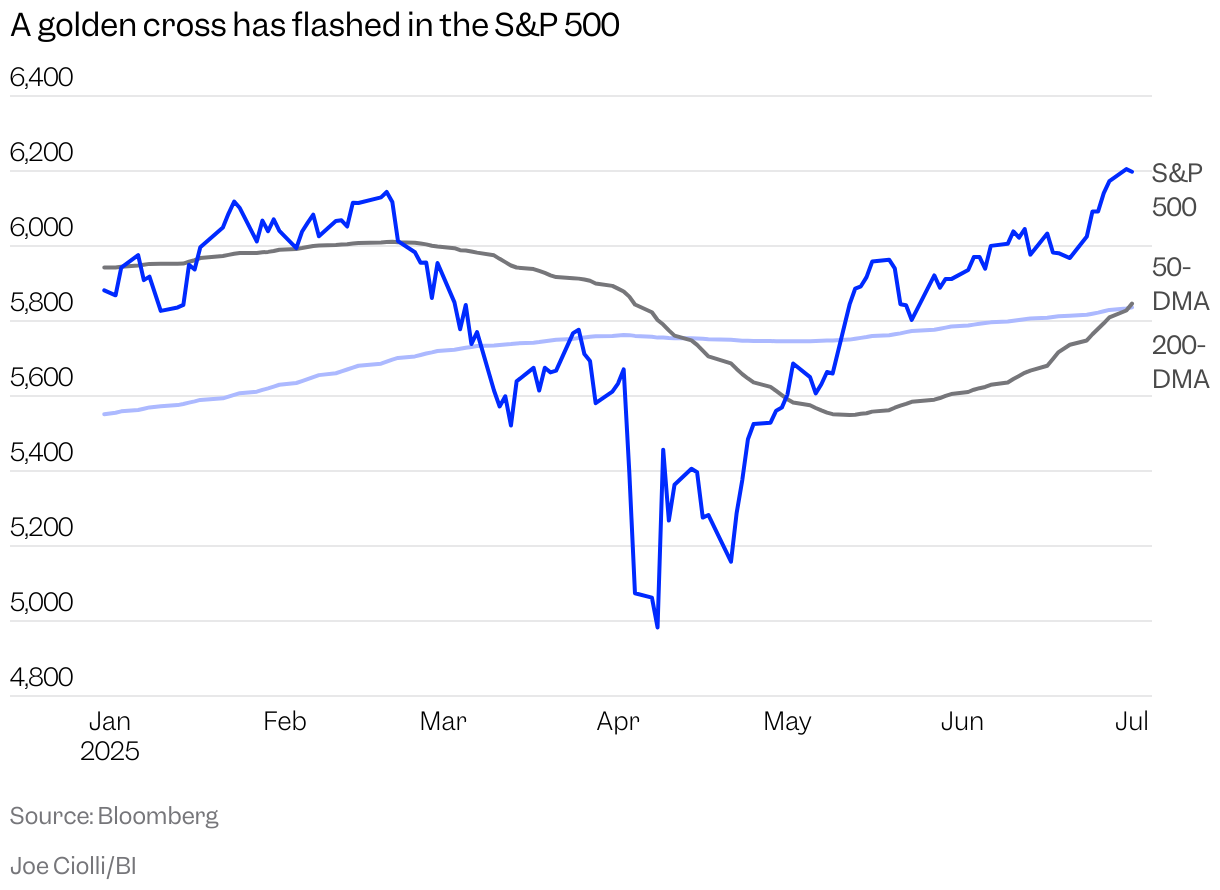
A moving average is a commonly used technical indicator that tracks the average S&P 500 closing price over a set period of time. The appearance of a golden cross means short-term price momentum has eclipsed the market’s broader trend, signifying the recent gains could shift the S&P 500’s long-term trajectory upward.

On the other hand, the bearish version of the signal is a death cross, which occurs when the 50-day moving average falls below the 200-day moving average. The S&P 500 and Nasdaq 100 flashed a death cross on April 14 this year at the height of the trade war volatility.

Historically, a strategy of buying the index at the golden cross and selling at the following death cross has led to higher returns than simply buying and holding, Jeff deGraaf, Renaissance Macro’s head of technical research, said in a note on Wednesday.

The strategy has a win rate of 73%, with 27 out of 37 past trades ending in profit and an average gain per trade of 14.7%, according to Fidelity.

Additionally, a crossover strategy has delivered 50% higher risk-adjusted returns than a simple buy-and-hold approach based on the Sharpe ratio, deGraaf said.

The market has made an impressive recovery from April lows. Back in May, the S&P 500 broke above its 200-day moving average. The golden cross comes as market breadth is expanding and more stocks participate in the rally, a sign that the rally has sustained momentum.

On Tuesday, 26% of S&P 500 components hit 65-day highs, deGraaf noted.

By sector, financial stocks are gaining momentum. The Financial Select Sector SPDR Fund (XLF) hit a fresh 52-week high, and seasonal trends for bank stocks, coupled with a more relaxed regulatory environment, point to more gains ahead.

Among consumer discretionary stocks, nearly 60% of names are making 20-day highs. If this sector of the market continues to improve, it could help confirm the next leg of the bull market.


Source link

Visited 1 times, 1 visit(s) today

Related Article

I sold my nursing company for $12.5 million and retired at 28

How much $1,000 invested in the S&P 500 a decade ago is worth today

Earlier this spring, investors were bracing for the worst. President Donald Trump unveiled a new regime of stiff tariffs that market watchers feared could reignite inflation and start a trade war with the potential to choke the global economy. The S&P 500, a measure of the broad U.S. stock market, plummeted by 19% between late

Stock Market Today: Record High Shows Good News Is Good News After Jobs Report

Stock Market Today: Record High Shows Good News Is Good News After Jobs Report

For investors, good news is good news again. US stocks rallied on Thursday, with the Dow Jones Industrial Average gaining more than 300 points and the S&P 500 clinching another record high. The jump followed a strong June jobs report, which showed that the US added more jobs than economists originally expected last month, while

Enforcement Directorate attaches Rs 131.5cr assets, luxury yacht in OctaFX forex trading scam case

Enforcement Directorate attaches Rs 131.5cr assets, luxury yacht in OctaFX forex trading scam case | Mumbai News

Mumbai: Enforcement Directorate (ED) has provisionally attached properties, including a luxury yacht and immovable properties in Spain, worth approximately Rs 131.5 crore in its ongoing investigation into unauthorised forex trading platform OctaFX.These assets belong to Russian national Pavel Prozorov, the alleged mastermind behind the platform OctaFx. The assets include movable properties in the form of

Investor fright over Reeves’ tears shows fragility of UK finances

Investor fright over Reeves’ tears shows fragility of UK finances

This week’s sell-off in UK gilts, sparked by a tearful Rachel Reeves in the House of Commons, showed how fragile investor confidence is in Britain’s precarious fiscal position.  The merest suggestion that the chancellor may leave her job, caused by Sir Keir Starmer’s initial failure to fully back her on Wednesday, was enough to spook

Nonfarm payrolls rise 147,000 in the month

Jobs report June 2025

Job growth proved better than expected in June, boosted by government hiring, as the labor market showed surprising resilience and likely took a July interest rate cut off the table. Nonfarm payrolls increased a seasonally adjusted 147,000 for the month, higher than the estimate for 110,000 and just above the upwardly revised 144,000 in May,

What’s closed for July 4 holiday, from Publix to post offices

Independence Day is almost here, and as you stock up on supplies or run errands, it is good to know what will be open, including the extended four-day weekend granted to state workers in Florida. In a June 23 news release, Gov. Ron DeSantis announced that state offices will be closed on Thursday, July 3,

EUR/USD Analysis 03/07: Bullish Stability Continues (Chart)

EUR/USD Analysis 03/07: Bullish Stability Continues (Chart)

EUR/USD Analysis Summary Today Overall Trend: Bullish. Today’s EUR/USD Support Levels: 1.1740 – 1.1680 – 1.1590. Today’s EUR/USD Resistance Levels: 1.1820 – 1.1880 – 1.2000. EUR/USD Trading Signals: Buy EUR/USD from the support level of 1.1630 with a target of 1.1820 and a stop-loss at 1.1560. Sell EUR/USD from the resistance level of 1.1840 with

Gold Analysis 03/07: Weakness Continues to Support Gold (graph)

Gold Analysis 03/07: Weakness Supports Gold (Chart)

Today’s Gold Analysis Overview: The overall Gold Trend: Bullish. Today’s Gold Support Levels: $3328 – $3280 – $3220 per ounce. Today’s Gold Resistance Levels: $3372 – $3390 – $3420 per ounce. Today’s gold trading signals update: Sell Gold from the resistance level of $3393 with a target of $3300 and a stop-loss at $3420. Buy

0
Would love your thoughts, please comment.x
()
x