NZD/USD Holds Near Four-Month Low

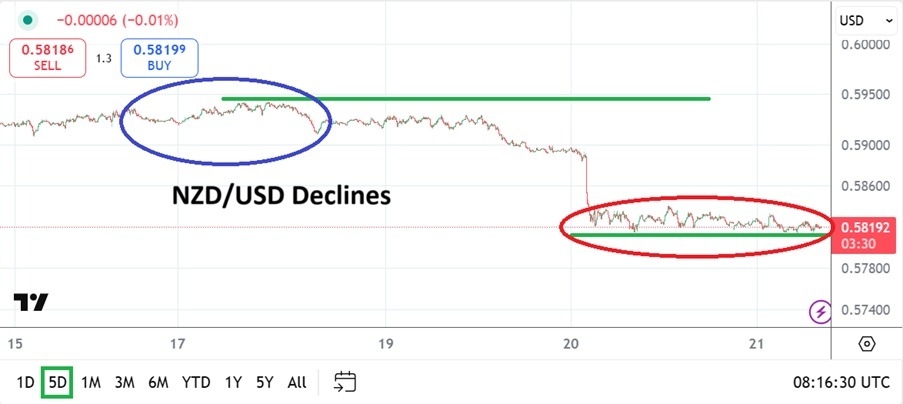
As today’s NZD/USD chart shows, the pair is trading near a four-month low following a sharp decline. The drop occurred yesterday after the Reserve Bank of New Zealand cut the official cash rate by 25 basis points to a three-year low of 3.0% and indicated that the rate could fall further to 2.55% by May 2026.

According to Trading Economics:

– Analysts now expect at least two additional rate cuts before the end of the year;

– There is a risk of deeper cuts depending on incoming economic data.

New Zealand’s exports are also under pressure, particularly due to the 15% US tariffs that came into effect earlier this month, threatening to undermine the country’s competitiveness in key markets. According to Reuters, Citi analysts expect GDP to contract in the second quarter, raising the risk of a recession in New Zealand.

Technical Analysis of the NZD/USD 4-Hour Chart

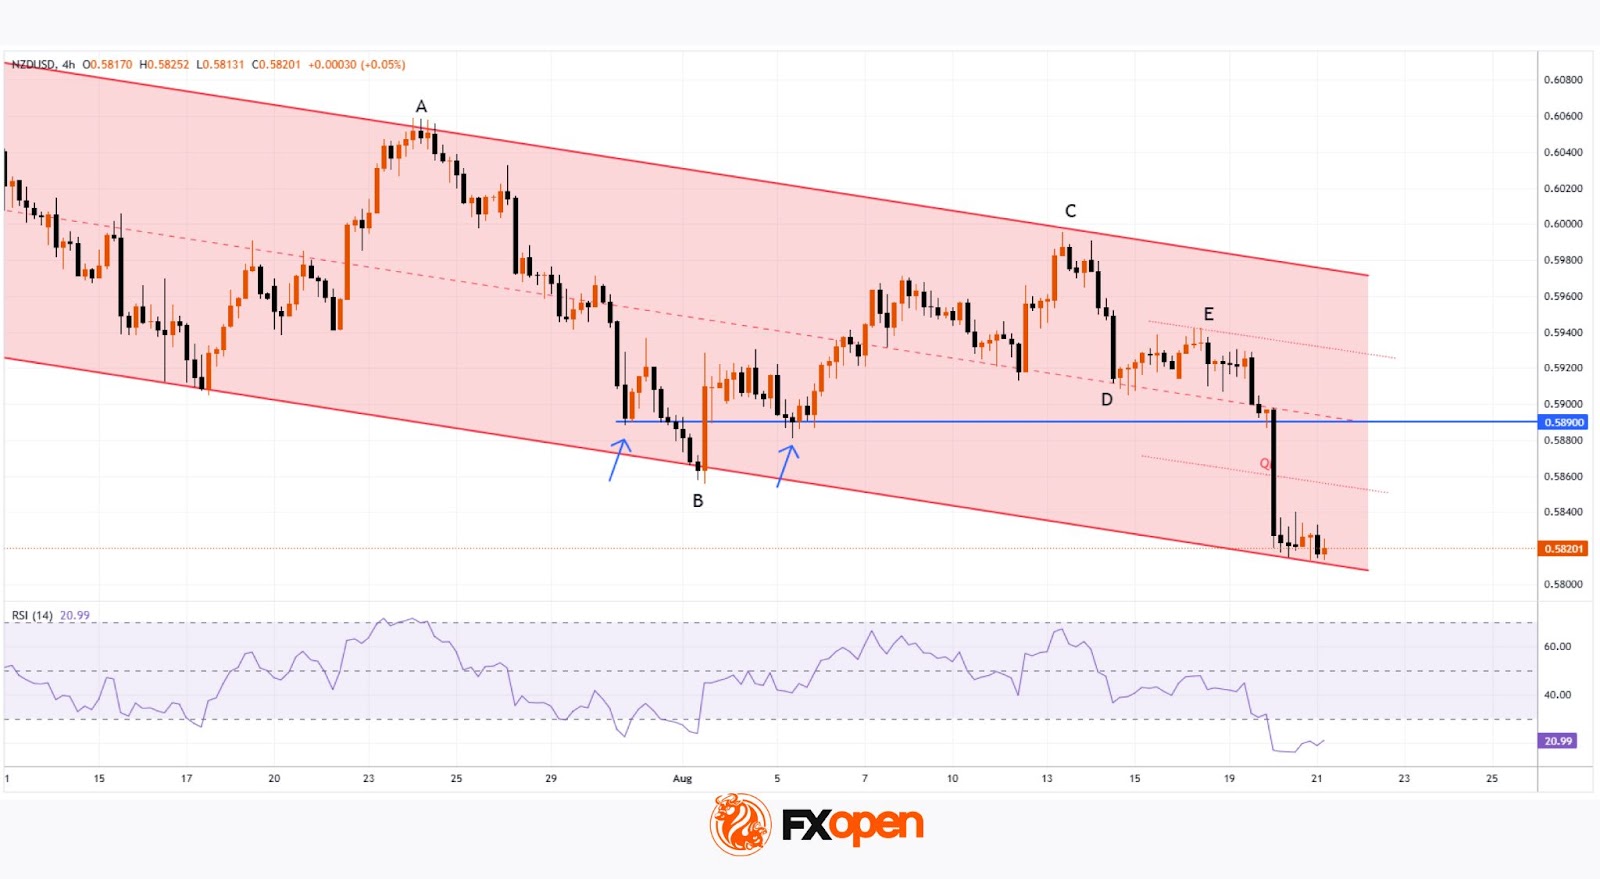
NZD/USD price action since early July has formed a downward channel (marked in red), reflecting a bearish outlook. Key observations:

→ Yesterday’s drop was sharp, with a very long candle closing near its lows – a bearish signal;

→ However, the lower boundary of the channel acted as strong support, holding back further pressure.

Looking at the broader context:

→ The B→C recovery reached approximately the 0.618 Fibonacci retracement level after the A→B impulse;

→ The D→E rebound from the channel’s median was modest, signalling weak demand.

Given the strength of the channel’s lower boundary and the oversold condition (as shown by the RSI), bulls have some grounds to expect a potential rebound. In that case, NZD/USD could face resistance from the QL line, which divides the descending channel into two quarters.

Reaching the resistance zone formed by the channel median and the 0.589 level (previously acted as support during the inverse head and shoulders pattern – highlighted with arrows) could be difficult in the near term under current conditions.

Trade over 50 forex markets 24 hours a day with FXOpen. Take advantage of low commissions, deep liquidity, and spreads from 0.0 pips. Open your FXOpen account now or learn more about trading forex with FXOpen.

This article represents the opinion of the Companies operating under the FXOpen brand only. It is not to be construed as an offer, solicitation, or recommendation with respect to products and services provided by the Companies operating under the FXOpen brand, nor is it to be considered financial advice.

Source link

Visited 1 times, 1 visit(s) today

Related Article

EUR/USD Analysis 21/08: Key Economic Readings (Chart)

EUR/USD Analysis 21/08: Key Economic Readings (Chart)

Created on August 21, 2025 EUR/USD Analysis Summary Today Overall Trend: Neutral with a downward bias. Today’s Support Levels: 1.1600 – 1.1550 – 1.1480. Today’s Resistance Levels: 1.1680 – 1.1730 – 1.1800. EUR/USD Trading Signals: Buy EUR/USD from the 1.1560 support level, with a target of 1.1800 and a stop-loss at 1.1500. Sell EUR/USD from

Goldman Traders Say It’s Time to Buy the Dip in Momentum Stocks

(Bloomberg) — Sharp losses in high-flying momentum stocks may present a dip-buying opportunity if history is any guide, according to Goldman Sachs Group Inc.’s trading desk. The traders cited rebounds after similar prior losses in Goldman’s High Beta Momentum basket, coupled with the current technical setup. Most Read from Bloomberg When the long-short momentum basket

Gold Analysis 21/08: USD Recovery Increases Losses (Chart)

USD Recovery Increases Losses (Chart)

Created on August 21, 2025 Today’s Gold Analysis Overview: The overall Gold Trend: Neutral with a downward bias. Gold Support Levels Today: $3310 – $3270 – $3220 per ounce. Gold Resistance Levels Today: $3360 – $3350 – $3410 per ounce. Today’s Gold Trading Signals: Buy gold from the $3290 support level, with a target of

AUD/USD technical forecast

AUD/USD Forecast Extends Losses as Traders Await Jackson Hole

AUD/USD forecast remains subdued amid sour risk sentiment. Fed meeting minutes show no hint of aggressive easing. Australian PMI data shows a surge in economic activity The AUD/USD forecast remains bearish on Thursday as the pair slides to 0.6420 during the European session. The price stays around the weakest level in two months after posting

Short sellers reap over $5 billion on Big Tech bets as AI fears roil market

Short sellers betting against some of the market’s leading AI stocks potentially made billions as markets slid this week and investors moved away from some of the year’s hottest tech trades. On Wednesday, tech stocks stumbled for a second day, with the tech-heavy Nasdaq Composite’s (^IXIC) 0.7% drop leading declines in the major averages as

GBP/USD Forex Signal: Bearish Pressure Builds (Chart)

GBP/USD Forex Signal: Bearish Pressure Builds (Chart)

Created on August 21, 2025 Bearish view Sell the GBP/USD pair and set a take-profit at 1.3350. Add a stop-loss at 1.3585. Timeline: 1-2 days. Bullish view Buy the GBP/USD pair and set a take-profit at 1.3585. Set a take-profit at 1.3350. The GBP/USD exchange rate pulled back for three consecutive days, even as the

NZD/USD Analysis Today 21/08: Bears in Control (Chart)

NZD/USD Analysis Today 21/08: Bears in Control (Chart)

Created on August 21, 2025 Price velocity downwards was sparked in the NZD on late Tuesday, and lows have been demonstrated the past day as the 0.58190 vicinity continues to be tested. The NZD/USD has shown a tendency to display bearish behavior the past couple of months. The selling action has not been a stable