Market Awaits Canadian Jobs Data (Chart)

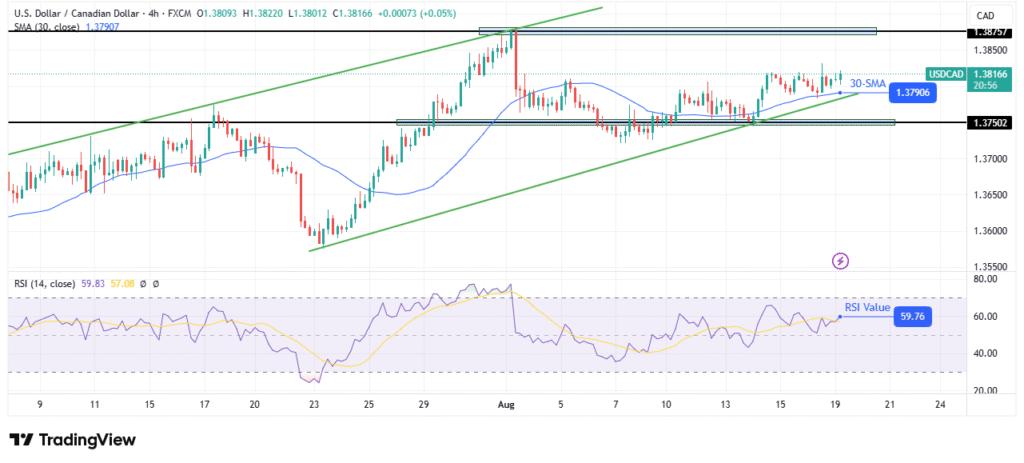
  • The US dollar has pulled back slightly against the Canadian dollar during the trading session on Wednesday, as we are now testing the 50 Day EMA.
  • That being said, there is still a bit of a disconnect in this market as the Canadians don’t have a deal with the United States, and despite the fact that the rest of the world has pretty much come to terms with the Americans.
  • With this, and the fact that we have the Canadian employment figures at the end of the week, I’ve been watching this pair very closely. Because of this, I would anticipate that the next day or 2 might be somewhat quiet, but by the time we get to Friday, you could see a fairly big move.

USD/CAD Forecast: Market Awaits Canadian Jobs Data (Chart)

Technical Analysis

As we look at the chart, the first thing that comes to mind is that the 50 Day EMA sits just below current trading and could offer a little bit of short-term technical support. Ultimately, this is a market that has recently been consolidating, but has since broken out to the upside, and now it looks as if the market participants are trying to retest the previous resistance for potential support. If we can break above the 1.38 level, then it opens up the possibility of an attack on the 1.3886 level, where the 200 Day EMA currently resides.

On the other hand, if we break down from here we could go looking to the 1.36 level, but I think we would need to see a huge divergence between the US and Canadian economies, something that just doesn’t happen most of the time. With this being the case, I still believe that the US dollar could very well rally from here, but you should also keep in mind that the US dollar is struggling and other places, so while the Canadian dollar may get a bit of a reprieve because of that, the reality is that this is a pair that is completely different at times.

Ready to trade our Forex USD/CAD predictions? Here are the best Canadian online brokers to start trading with.

Christopher Lewis has been trading Forex and has over 20 years experience in financial markets. Chris has been a regular contributor to Daily Forex since the early days of the site. He writes about Forex for several online publications, including FX Empire, Investing.com, and his own site, aptly named The Trader Guy. Chris favours technical analysis methods to identify his trades and likes to trade equity indices and commodities as well as Forex. He favours a longer-term trading style, and his trades often last for days or weeks.

Source link

Visited 1 times, 1 visit(s) today

Related Article

Natural Gas Forecast 19/08: Market Weakness Persists (Video)

Natural Gas Forecast 19/08: Market Weakness Persists (Video)

Created on August 19, 2025 The natural gas market is pretty noisy during the trading session here on Monday, initially dropping, but then turning around at this point. I think what we’re trying to do, some of you technical analysts out there might look at this as a potential liquidity grab. That’s not what it

Gold Analysis 19/8: Easing Concerns Increase Selling (Chart)

Easing Concerns Increase Selling (Chart)

Created on August 19, 2025 Today’s Gold Analysis Overview: The overall Gold Trend: Neutral with a downward bias. Gold Support Levels Today: $3320 – $3300 – $3260 per ounce. Gold Resistance Levels Today: $3370 – $3400 – $3460 per ounce. Today’s Gold Trading Signals: Buy gold from the $3290 support level, with a target of

USD/CAD technical outlook

USD/CAD Outlook: Loonie Slips Ahead of Key Inflation Data

The USD/CAD outlook shows the Canadian dollar weakening ahead of crucial inflation figures. Traders are anticipating policy clues at the Jackson Hole symposium. The US will guarantee the country’s safety in the event of a peace deal. The USD/CAD outlook deteriorates as the Canadian dollar weakens ahead of crucial inflation figures from Canada. Meanwhile, the dollar

USD/CHF Forex Signal 19/08: Market Awaits Fed (Chart)

USD/CHF Forex Signal 19/08: Market Awaits Fed (Chart)

Created on August 19, 2025 Potential signal: I am a buyer of the USD/CHF pair at the current level, but I would have a stop loss near the 0.7990 level. If the market can break above the 0.8150 level, then I am adding to the trade, roughly 20% of the initial position, and aiming for

GBP/USD technical price analysis

GBP/USD Price Analysis: Pound Holds Ground After Pullback

The GBP/USD price analysis shows the pound steady after a recent collapse. The US has promised to guarantee Ukraine’s safety in case of a peace deal. Traders are pricing in over an 80% chance of a Fed rate cut in September. The GBP/USD price analysis shows the pound steady after a recent collapse due to

AUD/USD Forex Signal 19/08: Bearish Divergence (Chart)

AUD/USD Forex Signal 19/08: Bearish Divergence (Chart)

Created on August 19, 2025 Bearish view Sell the AUD/USD pair and set a take-profit at 0.6400. Add a stop-loss at 0.6600. Timeline: 1-2 days. Bullish view Buy the AUD/USD pair and set a take-profit at 0.6600. Add a stop-loss at 0.6400. The AUD/USD pair remained flat on Tuesday, marking a fairly quiet week with

American Express Fundamental Snapshot 19/08

Is it Time to Sell? (Chart)

Created on August 19, 2025 Short Trade Idea Enter your short position between 299.17 (the lower band of its horizontal resistance level) and 313.62 (the lower band of its horizontal resistance level). Market Index Analysis American Express (AXP) is a member of the Dow Jones Industrial Average, the S&P 100, and the S&P 500 All

image

All Eyes on the Russia (Chart)

Created on August 19, 2025 EUR/USD Analysis Summary Today Overall Trend: Neutral with an upward bias. Support Levels Today: 1.1640 – 1.1560 – 1.1490. Resistance Levels Today: 1.1720 – 1.1800 – 1.1880. EUR/USD Trading Signals: Buy EUR/USD from the 1.1580 support level, with a target of 1.1800 and a stop-loss at 1.1500. Sell EUR/USD from