President Donald Trump‘s strikes against Iranian nuclear facilities over the weekend elicited concerns about the potential for gas prices to increase.
But they have mostly remained stagnant since Friday, before the attacks, and one analyst told Newsweek it appears that a cost surge at the pumps is unlikely at this point.
Why It Matters
The Trump administration on Saturday struck three Iranian nuclear sites—Fordow, Natanz and Isfahan—amid Tehran’s war with Israel. American officials have long been concerned that Iran was working to develop nuclear weapons, but Iranian officials have maintained that its nuclear program is strictly focused on energy production.
U.S. National Intelligence Director Tulsi Gabbard testified in March that Iran was not working on developing a nuclear weapon.
Iran has already retaliated, issuing its own strikes against a U.S. military base in Qatar. Experts have watched to see if Tehran could take steps to disrupt the global oil supply, such as cutting access to the Strait of Hormuz, a major corridor for oil exiting the region. At the moment, Iran has not done so.
What To Know
Gas prices across the United States surged amid the growing tensions between Iran and Israel earlier in June but have only risen slightly in the days after Trump’s strikes on Iran, according to data from AAA, which tracks gas prices in each state. Prices have even dropped a bit in some states like Florida.
In most states, prices have only changed a few cents per gallon, if that, in either direction since Friday, according to AAA data.

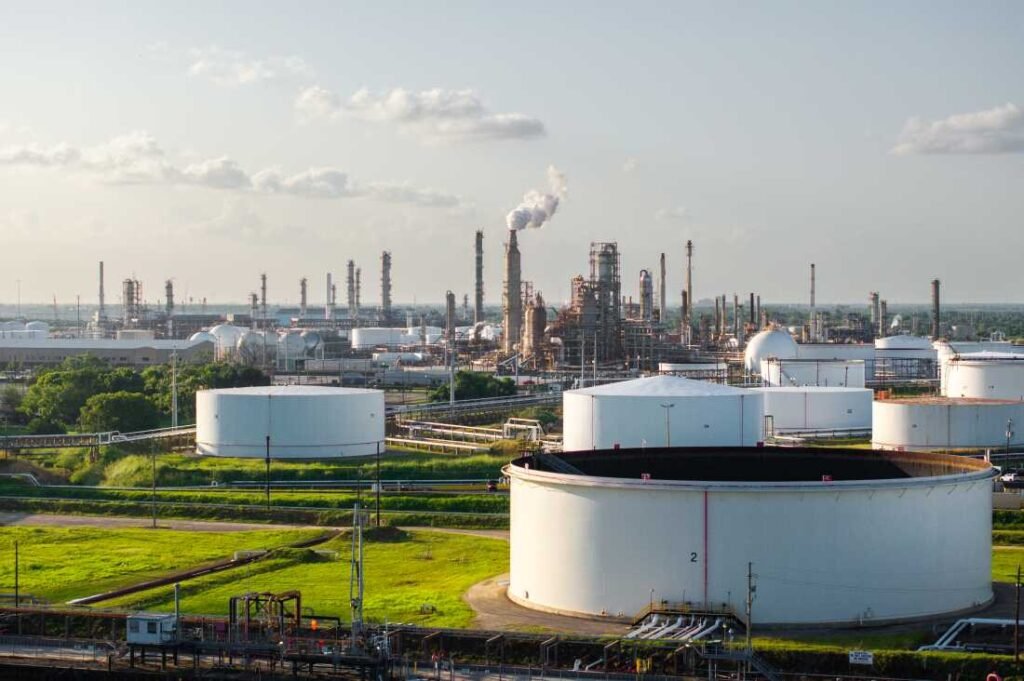
Brandon Bell/Getty Images
But gas prices have seen larger increases over the past week as the conflict created more uncertainty about the cost of oil. In addition to strife in the Middle East, seasonal trends are at play. Gas prices typically increase in the summer, particularly ahead of the July Fourth holiday.
This map shows how gas prices have changed from June 16 to June 23 amid the Israel-Iran conflict.
Will Gas Prices Rise After Striking Iran?
Patrick De Haan, head of petroleum analysis at GasBuddy, told Newsweek there are a lot of unknowns in terms of how the conflict could unfold, but dramatic increases in gas prices are not particularly likely over the coming days.
“Oil prices are now plummeting by more than seven percent. Based on these new developments, I think what the market is essentially saying here is that the conflict is winding down. Iran has now responded, retaliated. The Trump administration has said they don’t plan to retaliate. Iran may just be kind of ending this.”
What Is the Strait of Hormuz?
The Strait of Hormuz is a passageway between the Persian Gulf and Gulf of Oman and a major corridor for oil transportation out of the Middle East. If Iran shuts it down, experts say, the price of gas could increase worldwide.
Although Iran has discussed closing the strait for decades, it would “harm its own self interest” with a shutdown, De Haan said.
“It would also harm its relationships with neighbors in doing so. It’s something never happened—I don’t like to lend it credibility,” he said. “It’s not just like closing a door. It’s a waterway, so it would be extremely difficult for Iran to be able to pull something like that off.”
He said there are still “elevated” tensions, and that any further destabilization could sting. For now, however, markets are “betting the situation is in a de-escalation phase.”
Consumers concerned about gas prices should simply remain aware of what’s happening but do not necessarily need to be rushing to fill up their tanks, De Haan said.
“It doesn’t rise, in my opinion, to the level of being very worried,” he said. “Just being aware that the price of gas will probably be inching up as we approach July Fourth.”
What People Are Saying
De Haan also told Newsweek: “My advice as an analyst is just don’t be in any rush to fill your tank now because of oil prices dropping today. As long as that trajectory continues, as long as there’s not any escalation, the drop in oil that I’m witnessing today could start to be filtered down to gas and diesel pumps in the next three to five days.”
Trump wrote on Truth Social earlier Monday: “To The Department of Energy: DRILL, BABY, DRILL!!! And I mean NOW!!!”
Energy Secretary Chris Wright told CNBC on Monday: “I would not expect much movement of oil upwards from the tensions that are going on. We have seen a little bit in the run-up, but when it’s clear where America stands, I’m not surprised that oil prices are moved down a little bit. They moved down maybe more than I would have guessed. But, no, I think we’re in such a good position today. This American energy dominance that President Trump ran on, we’re at record high production of oil today, record high production of natural gas.”
Bob McNally, president of Rapidan Energy Group, told CNN: “Unless there’s a material interruption in gulf energy, production, or flows, I think any further spikes will be contained.”