These stock market valuation metrics look ominous.
You’ve no doubt heard the phrase, “What goes up can come down.” This adage continually lurks in the background of the brains of many investors who have lived long enough. They know that the good times never keep rolling indefinitely.
For now, the good times are rolling. All the major stock market indexes are near record highs. But is the stock market going to crash in 2026?
Image source: Getty Images.
Warren Buffett’s favorite valuation indicator
One big reason for investors to be worried relates to an indicator popularized by none other than Warren Buffett. The investing icon said in an article published by Fortune in 2001 that the ratio of total market capitalization to gross national product (GNP) was “probably the best single measure of where valuations stand at any given moment.” This metric became known as the Buffett indicator, with gross domestic product (GDP) replacing GNP over time.
Buffett said something else in that 2001 article that’s haunting, though. He stated that if the ratio ever gets close to 200%, investors are “playing with fire.”
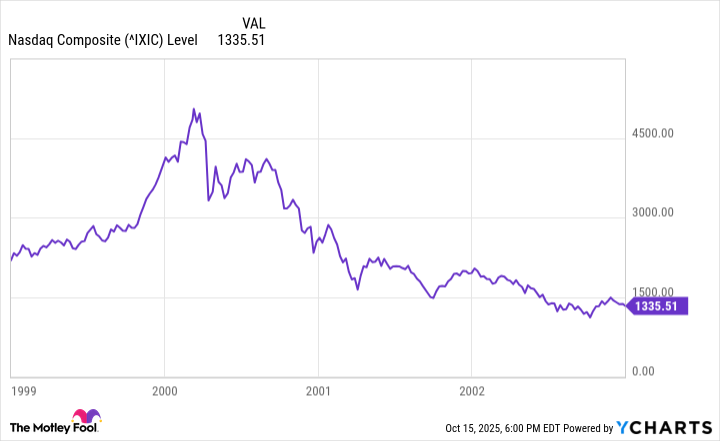
History proves that the Oracle of Omaha was right. As Buffett noted in the Fortune article, the indicator that now bears his name approached 200% in 1999 and part of 2000. What happened next? The dot-com bubble burst, with the stock market (especially the tech-heavy Nasdaq Composite Index (NASDAQINDEX: ^IXIC)) beginning a multiyear decline.
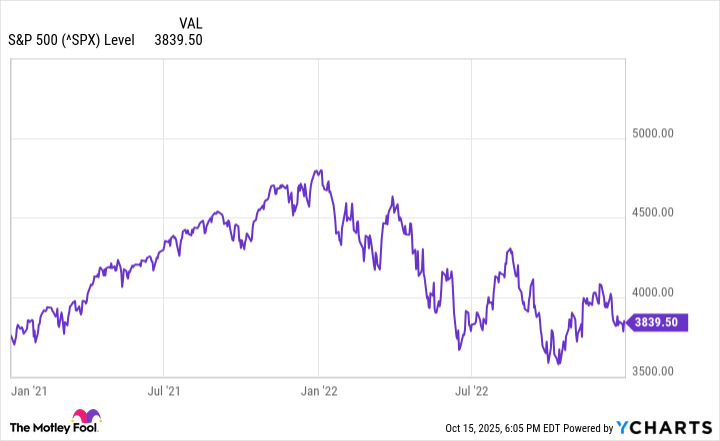
The Buffett indicator came close to 200% again in late 2022. Within a couple of months, the S&P 500 (SNPINDEX: ^GSPC) peaked. A bear market soon ensued, with the S&P 500 falling more than 25% below its high at one point.
Guess what the Buffett indicator’s level is right now? It’s at an all-time high of 219%. Per Buffett’s own words, investors are “playing with fire.”
Robert Shiller’s namesake indicator
Buffett isn’t the only financial legend with a valuation metric bearing his name. Yale economics professor Robert Shiller co-developed the cyclically adjusted price-to-earnings (CAPE) ratio, which became known as the Shiller CAPE ratio.
This indicator averages inflation-adjusted earnings over the previous 10 years for a company or a stock market index. The idea is that looking at a longer period provides a better perspective that smooths out the impact of economic cycles.
The S&P 500 Shiller CAPE ratio has been eerily prescient in predicting major stock market declines. Note the spike in 1929 on the chart below. It preceded the infamous stock market crash in October of that year. The highest value ever for the metric came in late 1999 and early 2000. As previously mentioned, the dot-com bubble burst soon afterward. Another peak occurred in late 2021, with the stock market plunging the following year.
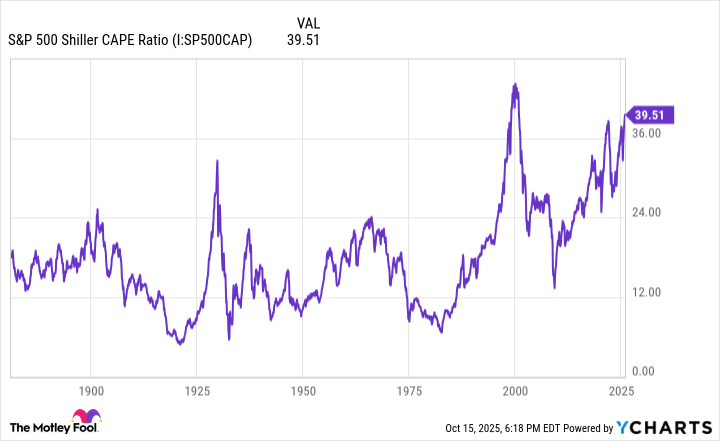
S&P 500 Shiller CAPE Ratio data by YCharts. CAPE Ratio = cyclically adjusted price-to-earnings ratio.
You might have noticed that the S&P 500 Shiller CAPE ratio is at its second-highest level ever right now. If history is a guide, a market downturn could be right around the corner.
Is a crash coming next year?
These two indicators are flawless in forecasting market meltdowns. So, is a stock market crash inevitable next year? I wouldn’t go that far.
It’s important to note that there are few historical precedents for the Buffett indicator and the S&P 500 Shiller CAPE ratio hitting super-high levels. As such, they don’t meet the requirements for being statistically significant.
Also, stocks can remain at frothy valuations for long periods. Former Federal Reserve Chairman Alan Greenspan famously used his “irrational exuberance” phrase describing the stock market on Dec. 5, 1996. The S&P 500 nearly doubled between then and the end of 1999.
However, I don’t think investors should ignore the Buffett indicator and the S&P 500 CAPE ratio. These indicators absolutely point to historically high valuations. Don’t assume that a stock market crash is on the way, but be prepared for one just in case. That means buying stocks that are valued attractively relative to their growth prospects and building cash reserves.
Most importantly, though, maintain a long-term perspective. Stocks ultimately rebounded and set new highs following all the stock market crashes in the past. They’ll almost certainly do so after the next crash — whenever it happens.
Keith Speights has no position in any of the stocks mentioned. The Motley Fool has no position in any of the stocks mentioned. The Motley Fool has a disclosure policy.