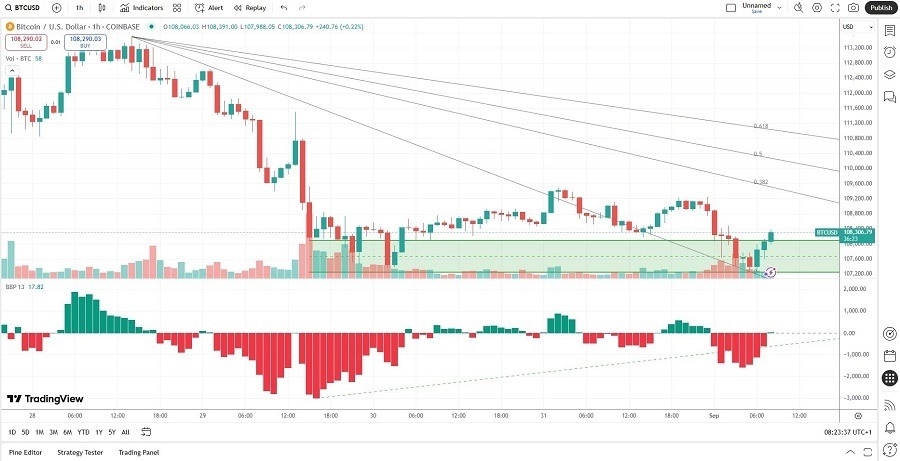
Is the Breakout Valid (Chart)

Today’s BTC/USD Signals

BTC/USD Forex Signal 01/09: Is the Breakout Valid (Chart)

Long Trade Idea

  • Long entry between $107,250 and $108,089, the lower and upper bands of its horizontal support zone.
  • Place your stop-loss level at $200 below your entry level.
  • Adjust the stop-loss to break even once the trade is $500 in profit.
  • Take off 50% of the position as profit when the price reaches $500 in profit and leave the remainder of the position to run.

Short Trade Idea

  • Short entry if price action breaks down below $106,750, $500 below the lower band of its horizontal support zone.
  • Place your stop-loss level $200 above your entry level.
  • Adjust the stop-loss to break even once the trade is $500 in profit.
  • Take off 50% of the position as profit when the price reaches $500 in profit and leave the remainder of the position to run.

The best method to identify a classic “price action reversal” is for an hourly candle to close, such as a pin bar, a doji, an outside, or even just an engulfing candle with a higher close. You can exploit these levels or zones by watching the price action that occurs at the given levels.

BTC/USD Fundamental Analysis

BTCUSD Fundamental Analysis

BTC/USD Technical Analysis

So, why am I bullish on BTC/USD after its earlier breakout?

Price action completed its post-all-time-high sell-off after dropping to 107,250. Price action quickly reversed and completed a breakout above its horizontal support zone, with rising volume. I see the descending 38.2% Fibonacci Retracement Fan as the next minor resistance level. A continuation of the breakout sequence is possible with $111,105, the intra-day high before a reversal, as the next target.

The Bull Bear Power Indicator has improved over the past five hours and has completed a bullish crossover. I believe it will strengthen further into the morning session and confirm the breakout.

Bullish momentum could accelerate as the breakout may result in a short-covering rally. It will wash out the latest short positions betting on a test of the psychological 100,000 support level. Crypto traders should get $500 to $750 from this long position, but it could magnify with a breakout above the 38.2% Fibonacci Retracement Fan.

BTCUSD Forex Signal 01/09 (Graph)

Bitcoin/USD Price Chart

There is nothing of high importance scheduled today concerning either Bitcoin or the USD. It is a public holiday today in the USA.

Ready to trade our daily Forex signals? Check out our list of the best MT4 crypto brokers.

Source link

Visited 1 times, 1 visit(s) today

Related Article

Jim Cramer Reveals Key Factor For AI Stock NVIDIA Corporation (NVDA) That No One’s Talking About

We recently published 9 Stocks On Jim Cramer’s Radar . NVIDIA Corporation (NASDAQ:NVDA) is one of the stocks Jim Cramer recently discussed. Jim Cramer Reveals Key Factor For AI Stock NVIDIA Corporation (NVDA) That No One’s Talking About Posonskyi Andrey/Shutterstock.com Cramer’s remarks about NVIDIA Corporation (NASDAQ:NVDA) were interesting since they were made before the firm’s second-quarter

Via Launches Initial Public Offering

NEW YORK, September 03, 2025–(BUSINESS WIRE)–Via Transportation, Inc. (“Via”), a leading provider of technology to power public transit networks, today announced the launch of its roadshow for the initial public offering of 10,714,285 shares of its Class A common stock. Via is offering 7,142,857 shares of Class A common stock and the selling stockholders are

Xcel Energy Fundamental Analysis Snapshot

Xcel Energy Signal 03/09: Follow the Breakdown (Chart)

Created on September 03, 2025 Short Trade Idea Enter your short position between $71.53 (yesterday’s intra-day low) and $72.91 (the lower band of its horizontal resistance zone). Market Index Analysis Xcel Energy (XEL) is a member of the NASDAQ 100 and the S&P 500. Both indices move away from all-time highs, as bearish pressures dominate.

Gold Forecast Today 03/09: Breaks Resistance (Chart)

Gold Forecast Today 03/09: Breaks Resistance (Chart)

Created on September 03, 2025 Gold markets continue to see a whole lot of buying pressure during the Tuesday session, as the futures market is threatening the $3600 level already. The size of the candle is very strong, not to mention the fact that there is a significant amount of volume for the session as

USD/CHF Forecast 03/09: Buyers Defend 0.80 Support (Chart)

Buyers Defend 0.80 Support (Chart)

Created on September 03, 2025 The US dollar has seen significant buying pressure during the trading session on Tuesday, not only against the Swiss franc, but multiple currencies around the world. That being said, in the USD/CHF pair, it looks as if the 0.80 level has offered enough of a reason to start buying again

Google Forecast 03/09: Gaps Lower to Start Week (Chart)

Gaps Lower to Start Week (Chart)

Created on September 03, 2025 Google (Alphabet) has seen a massive gap to kick off the trading week, as the market may have gotten a little bit too far ahead of itself. Wall Street overall looks rather poor during the trading session on Tuesday, and Google will be one of the biggest companies that people