Is Kyivstar Group a Smart Opportunity After Steady 9.5% Gains in 2025?
If you are wondering what approach to take with Kyivstar Group stock, you are definitely not alone. People are eyeing the recent ups and downs with curiosity and a touch of hesitation. Over the last week, the stock managed a modest gain of 1.0%, but that stands out against a backdrop of a 7.4% slide over the past month. Year to date, though, Kyivstar Group is actually up by 9.5%. This suggests that sentiment swings and market developments might be fueling some mixed signals for potential investors.
With uncertainty swirling globally, some of Kyivstar Group’s recent price movements can be traced to shifting risk appetites among investors, particularly as regional and sector dynamics evolve. It is the kind of environment that makes investors extra focused on whether the company represents a solid value right now or if a better opportunity might emerge later.
This is where things get interesting. On a composite valuation score, Kyivstar Group clocks in at 4 out of 6 possible checks for being undervalued. Put simply, analysts see strong indications in four key measures that this stock could be priced lower than its true worth. But what does that really mean for your decision?
Let’s walk through those different valuation checks together, seeing where Kyivstar Group stands out and where it might fall short. And stick around, because while the classic ways to spot an undervalued stock are handy, there is an even smarter method we will get to at the end.
The Discounted Cash Flow (DCF) model estimates a company’s true value by projecting its future cash flows and then discounting them back to today’s dollars. This helps investors understand what the business is worth, based purely on its ability to generate cash in the future.
For Kyivstar Group, analysts estimate the company currently generates Free Cash Flow of $271.18 Million. Over the next several years, projections see this figure increasing modestly each year, reaching $304 Million by the end of 2029. While analyst coverage ends around five years out, models from Simply Wall St extend these projections up to 2035, relying on industry growth assumptions for later years. All figures are reported in US dollars.
Taking these expected cash flows and discounting them back, the DCF model calculates Kyivstar Group’s fair value at $30.79 per share. This is a significant 64.4% above the current market price, pointing to a considerable undervaluation. In simple terms, the market is pricing Kyivstar Group well below what its cash-generating ability suggests.
Our Discounted Cash Flow (DCF) analysis suggests Kyivstar Group is undervalued by 64.4%. Track this in your watchlist or portfolio, or discover more undervalued stocks.
The Price-to-Earnings (PE) ratio is a widely used method for valuing profitable companies because it directly measures what investors are willing to pay today for a dollar of current earnings. For businesses like Kyivstar Group, which generate solid profits, the PE ratio offers a clear indicator of market expectations and can flag potential bargains or expensive stocks.
However, not all PE ratios are created equal. Investors tend to pay higher PE multiples for companies with stronger growth prospects or lower perceived risk, while more mature or riskier companies typically trade at a discount. Understanding the context behind a PE ratio is crucial for making informed decisions rather than relying on the number alone.
Currently, Kyivstar Group trades at a PE ratio of 8.28x, which is noticeably lower than both the Wireless Telecom industry average of 18.48x and the peer group average of 53.33x. At first glance, this large discount might suggest an undervalued opportunity. But context matters, and this is where the concept of a “Fair Ratio,” Simply Wall St’s proprietary metric, comes into play. Unlike traditional benchmarks, the Fair Ratio adjusts for Kyivstar Group’s specific growth outlook, profit margins, risks, industry positioning, and market cap. This provides a more tailored and meaningful fair value multiple for the company.
Comparing the Fair Ratio to Kyivstar Group’s actual PE ratio, the numbers are almost identical, with less than a 0.10 difference. This suggests the stock is neither meaningfully undervalued nor overvalued based on these factors, sitting right in line with its fair value.
Earlier we mentioned there is an even better way to understand valuation, so let’s introduce you to Narratives. In simple terms, a Narrative is your personal story behind the numbers—your view on what will shape a company’s future revenue, earnings, and margins, and where you believe its fair value lies.
Narratives connect the dots between a company’s story, financial forecast, and resulting fair value. This gives you more than just ratios or models to work from. On Simply Wall St’s platform, millions of investors can create, view, and update Narratives from the Community page. This makes complex analysis both easy and accessible.
This tool empowers you to compare your fair value to the current price and decide when to buy or sell. As new data such as news or earnings releases become available, Narratives are dynamically refreshed so your perspective always stays relevant.
For Kyivstar Group, some investors may be highly optimistic, projecting strong growth and higher fair values, while others might see slower momentum and estimate lower values. These diverse Narratives illustrate how perspectives can differ even with the same data set.
NasdaqGS:KYIV Earnings & Revenue History as at Sep 2025
This article by Simply Wall St is general in nature. We provide commentary based on historical data and analyst forecasts only using an unbiased methodology and our articles are not intended to be financial advice. It does not constitute a recommendation to buy or sell any stock, and does not take account of your objectives, or your financial situation. We aim to bring you long-term focused analysis driven by fundamental data. Note that our analysis may not factor in the latest price-sensitive company announcements or qualitative material. Simply Wall St has no position in any stocks mentioned.
In its most contested awards to date, Holiston Media has revealed the winners of this year’s Global Forex Awards – Retail, with some big names coming out on top. Now in its seventh year, The Global Forex Awards 2025 – Retail are the largest awards of their kind with over 50 global and regional categories
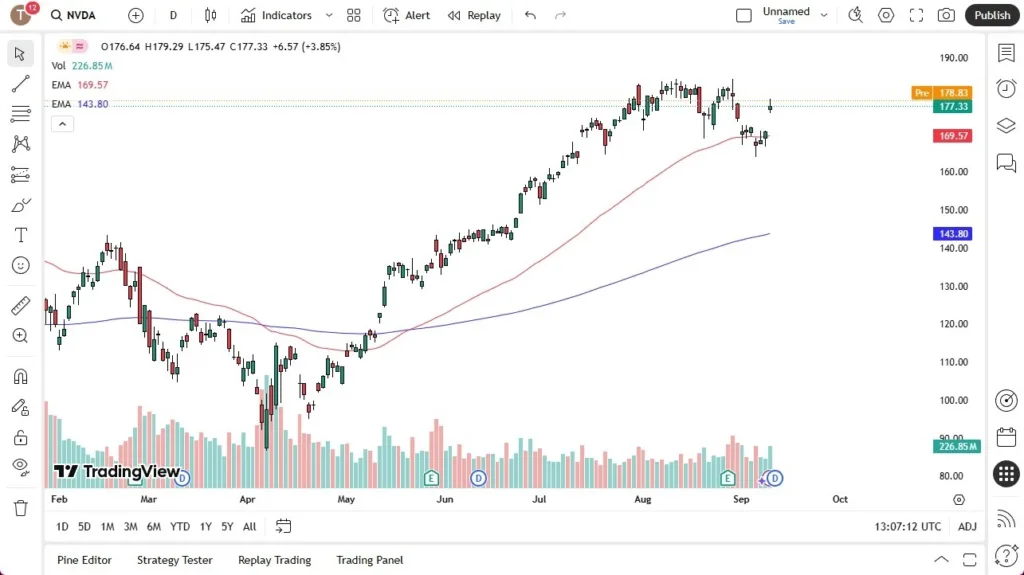
Created on September 12, 2025 The market fit in Nvidia looks like it’s going to open a little bit higher during the trading session here on Thursday as pre-market trading has been positive. That’s rather impressive considering we jumped about 4 % during the previous session and now it looks like we are heading toward
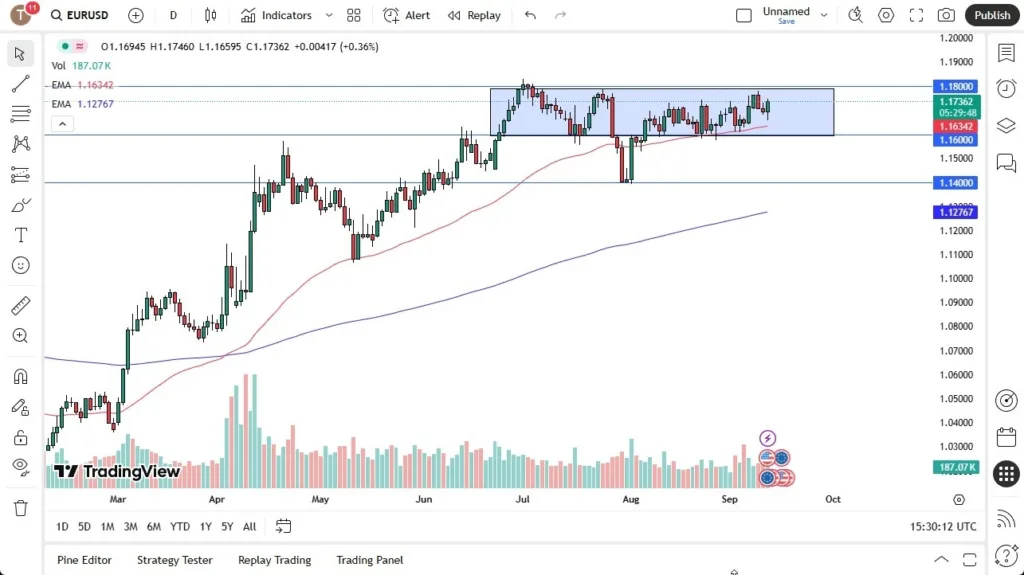
Created on September 12, 2025 The Euro initially fell on Thursday but has turned around to show signs of life as the ECB meeting and the CPI numbers have come and gone. The ECB meeting was essentially what people expected, as the European Central Bank is going to hold rates, and will “watch the data.”
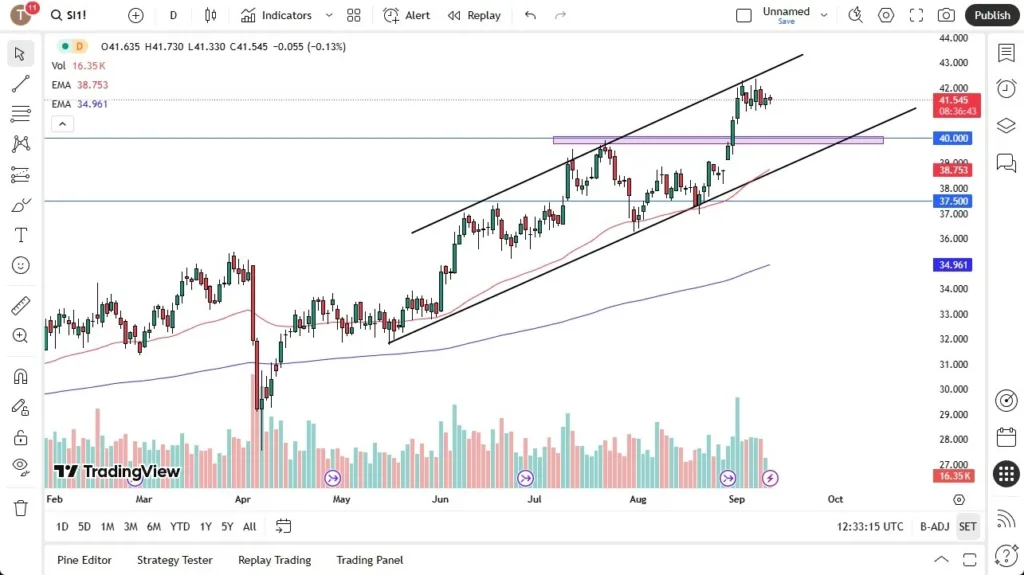
Created on September 12, 2025 Potential signal: I am buying silver if it reaches $42.60, with a stop loss at $42, and a target of $44.60 level. Silver has gone back and forth during the trading session here on Thursday in the early hours as we continue to see a lot of consolidation and absorption
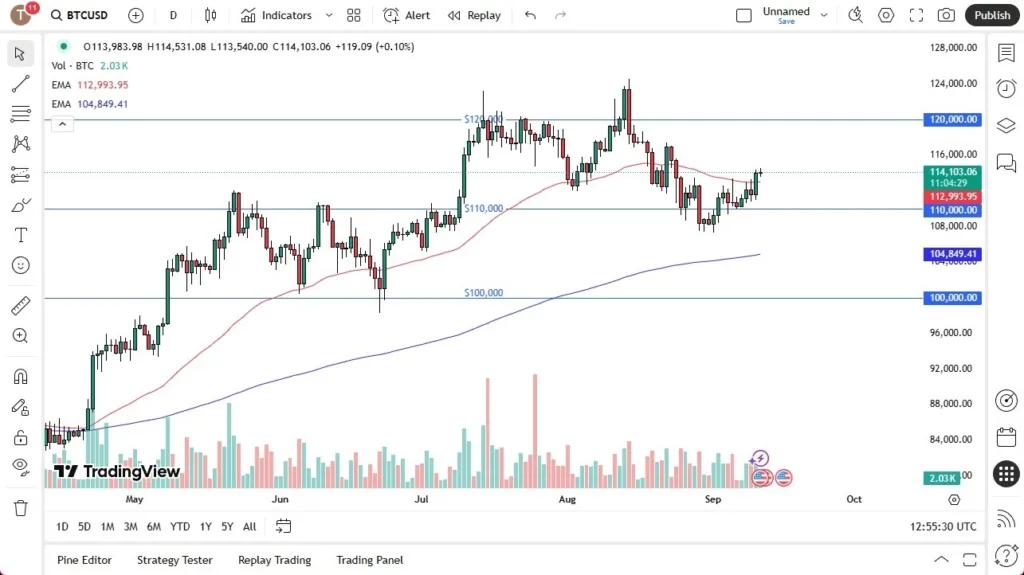
Created on September 12, 2025 Bitcoin has shown itself to be rather sideways and quiet during the trading session here on Thursday as we are sitting just above the crucial 50-day EMA and trying to absorb a lot of the bullish pressure that we had seen from the previous candlestick on Wednesday. At this point,
Created on September 12, 2025 The New Zealand dollar has shown itself to be a little bit resilient during the trading session on Thursday after forming a couple of shooting stars. This is a very interesting currency pair to me because it obviously represents risk appetite. But at the same time, we’ve recently seen the
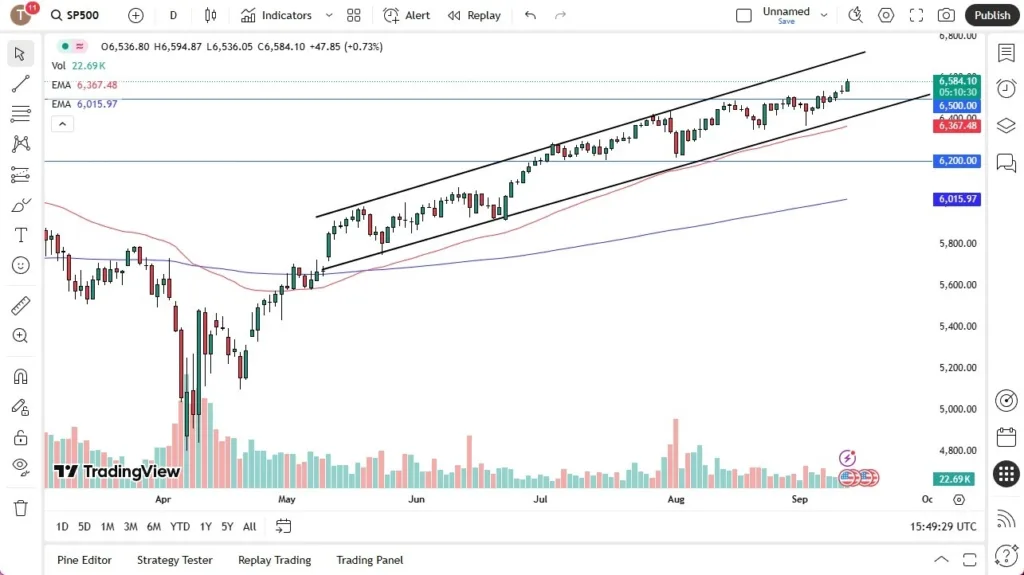
Created on September 12, 2025 The S&P 500 rallied during the trading session on Thursday, breaking above the 6580 level rather quickly. That being said, the market is likely to continue to be very noisy, but I think given enough time we will continue to see buyers jumping into this market as Wall Street continues
On September 12, the Shanghai Composite Index broke through its previous high of 3,888.60 points during trading, setting a new phase high; the Shenzhen Component Index rose above the 13,000-point mark during trading, reaching its highest level since July 2022. Morgan Stanley noted that U.S. investors’ interest in Chinese equities has risen to its highest