Is a Correction Ahead? (Chart)

Short Trade Idea

Enter your short position between $47.38 (Friday’s intra-day low) and $48.37 (the lower band of its horizontal resistance zone).

Market Index Analysis

  • Fastenal (FAST) is a member of the NASDAQ 100 and the S&P 500 indices.
  • Both indices are near record highs, but bearish chart patterns have formed.
  • The Bull Bear Power Indicator of the S&P 500 shows a negative divergence.

Market Sentiment Analysis

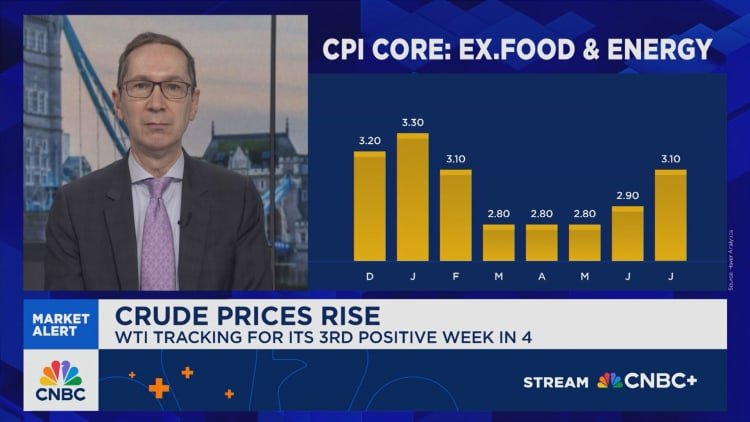
Friday’s NFP report confirmed a swiftly deteriorating labor market, but futures suggest a positive start to the week with inflation data front and center. Expectations call for a 25-basis-point interest rate this month, but it could be a one-and-done move, especially if inflation data surprises to the upside this week. Volatility could remain elevated this week as traders assess whether the weak economic data that they celebrated is too weak. Stagflation remains a primary threat that the markets often overlook.

Fastenal Fundamental Analysis

Fastenal is an industrial supply and stock-keeping unit with over 690,000 items. It refers to itself as a supply chain solutions company. It primarily caters to the construction and manufacturing sectors.

So, why am I bearish on FAST after its breakdown?

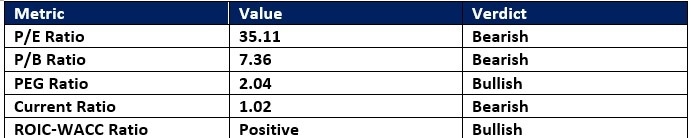
The contraction in free cash flow margin is one reason I believe the breakdown could result in a correction for Fastenal, which trades at unjustifiable valuations. FAST burns cash to defend its market position as the economic outlook soured to stagflation conditions. The PEG ratio confirms limited upside ahead, and the current share price trades above the average analyst’s share price. FAST has also increased its overall share count over the past year, diluting existing shareholder value.

Metric

Value

Verdict

P/E Ratio

46.14

Bearish

P/B Ratio

14.47

Bearish

PEG Ratio

3.99

Bearish

Current Ratio

4.22

Bullish

ROIC-WACC Ratio

Positive

Bullish

The price-to-earnings (P/E) ratio of 46.14 makes FAST an expensive stock. By comparison, the P/E ratio for the S&P 500 is 28.97.

The average analyst price target for FAST is 43.85. It confirms that price action overshot its target with rising downside risks.

Fastenal Technical Analysis

Today’s FAST Signal

image

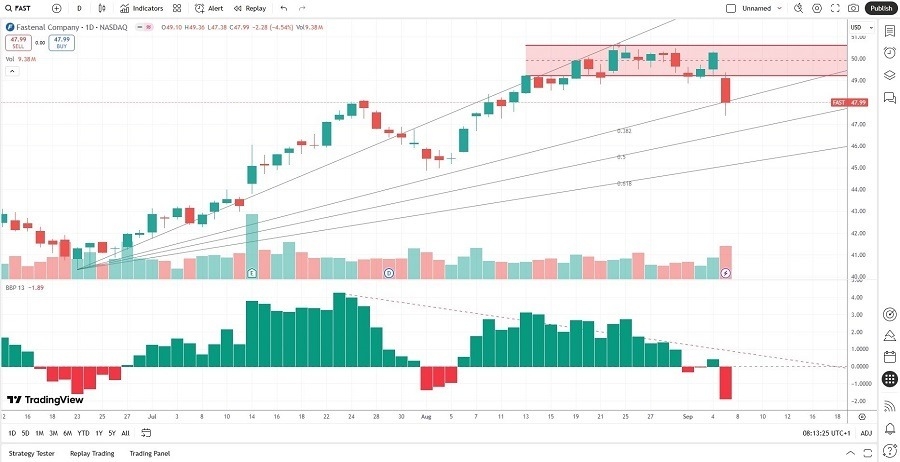
  • The FAST D1 chart shows a breakdown below its horizontal resistance zone.
  • It also shows price action challenging its ascending 38.2% Fibonacci Retracement Fan level.
  • The Bull Bear Power Indicator turned bearish with a descending trendline.
  • The average bearish trading volumes are higher than the average bullish trading volumes.
  • FAST advanced with the S&P 500, but completed its breakdown, which is a bearish trading signal.

My Call on Fastenal

I am taking a short position in FAST between $47.38 and $48.37. Over the past two years, revenue growth has slowed, and free cash flow margins have been contracting. Valuations are high, confirmed by the PEG ratio, and I expect more downside following the breakdown amid stagflation economic conditions.

  • FAST Entry Level: Between $47.38 and $48.37
  • FAST Take Profit: Between $37.38 and $40.36
  • FAST Stop Loss: Between $50.60 and $51.62
  • Risk/Reward Ratio: 3.11

Ready to trade our free daily signals? Here is our list of the best brokers for trading worth checking out.

Source link

Visited 1 times, 1 visit(s) today

Related Article

Morris: The Fed has to balance inflation pressures with a weak labor market

Here’s the inflation breakdown for August 2025 — in one chart

Shoppers browse shoes at a store in Los Angeles on Aug. 28, 2025. Bloomberg | Bloomberg | Getty Images Inflation picked up in August amid higher prices for staples like food and electricity, while tariffs put upward pressure on prices for physical goods like clothing and household furniture, economists said. The consumer price index, a

NZD/USD Analysis 11/09: Near-Term Incremental (Chart)

NZD/USD Analysis 11/09: Near-Term Incremental (Chart)

Created on September 11, 2025 After stumbling to value that challenged the 0.58000 level in late August, the NZD/USD has been able to produce a hard fought incremental climb higher and is near the 0.59300 ratio as of this writing. The NZD/USD has found buyers in the past two weeks, but day traders have had

Opendoor stock soars 60% after company names new CEO

OpenDoor is disrupting the real estate market with its new model. It buys homes and sells them on its platform. Opendoor Opendoor stock rocketed 60% higher on Thursday after the retail favorite named Shopify executive Kaz Nejatian as CEO and co-founder Keith Rabois as chairman. The meme stock hit a 52-week high and continued a

USD/RUB Analysis 11/09: Increase in Tensions (Chart)

USD/RUB Analysis 11/09: Increase in Tensions (Chart)

Created on September 11, 2025 The USD/RUB has gone from a rather tranquil value of 80.0000 in the past few days to above 85.0000 as of yesterday, this as it appears tensions are building and the prospects of increased conflict escalates. Since the first week of May this year the USD/RUB has seen trading within

Gold Analysis 11/09: Gold Prices Stable (Chart)

Gold Analysis 11/09: Gold Prices Stable (Chart)

Created on September 11, 2025 Today’s Gold Analysis Overview: Overall Gold Trend: Strongly bullish. Support Levels: $3610 – $3570 – $3500 per ounce. Resistance Levels: $3670 – $3690 – $3730 per ounce. Today’s Gold Trading Signals: Sell: Sell gold from the $3685 resistance level, with a target of $3540 and a stop-loss at $3710. Buy:

Inflation climbs in August as grocery and gas prices jump : NPR

Grocery prices jumped 0.6% in August, fueling a sharper-than-expected jump in inflation last month. Frederic J. Brown/AFP hide caption toggle caption Frederic J. Brown/AFP Inflation inched higher last month as Americans closed out the summer paying more for both groceries and gasoline. Consumer prices in August were up 2.9% from a year ago, according to

Amazon.com Fundamental Analysis Snapshot

What Will Follow the Breakdown (Chart)

Created on September 11, 2025 Short Trade Idea Enter your short position between $229.10 (yesterday’s intra-day low) and $238.85 (the upper band of its horizontal resistance zone). Market Index Analysis Amazon.com (AMZN) is a member of the NASDAQ 100, the Dow Jones Industrial Average, the S&P 100, and the S&P 500 indices. All four indices

Why Is Opendoor (OPEN) Stock Soaring Today

This article first appeared on GuruFocus. Sep 11 – Opendoor (NASDAQ:OPEN) shares jump about 30% in early Thursday trading after the company names Kaz Nejatian as CEO and brings co-founder Keith Rabois back as chairman. The move follows last month’s resignation of Carrie Wheeler amid investor pressure and a period of intense retail interest that