Major U.S. indexes experienced a choppy but overall positive holiday-shortened trading week. The S&P 500 and the tech-heavy Nasdaq Composite gained 1.02% and 1.96%, respectively, last week, hovering near all-time highs. The Dow Jones Industrial Average inched slightly up by 0.23%. Weakness in the U.S. labor market has fueled investor optimism for an early Federal Reserve interest rate cut at its September 16-17 meeting, driving positive market momentum. However, a grim jobs report, persistent inflation and the impact of trade policies have intensified recession fears.
The Fed’s preferred inflation measure, the Personal Consumption Expenditures (PCE) price index, rose 0.3% in July, resulting in a 2.6% rise on a year-over-year basis. The core prices (excluding food and energy) rose to 2.9%, the highest level in five months. The August jobs report showed weaker-than-expected data. The economy added only 22,000 jobs, far below economists’ expectations of 75,000. Additionally, the number of Americans filing for unemployment benefits rose by 8,000 to 237,000 for the week ending August 30.
The unemployment rate rose to 4.3%, its highest level since 2021. The labor market is cooling significantly, which is a cause for concern for the overall economic momentum. Moody’s Chief Economist, Mark Zandi, has also cautioned that the economy is on the verge of a recession. It is vital for the Fed to carefully strike the right balance between supporting growth and curbing inflation.
Regardless of market conditions, we, here at Zacks, provide investors with unbiased guidance on how to beat the market.
As usual, Zacks Research guided investors over the past three months with its time-tested methodologies. Given the prevailing market uncertainty, you may want to look at our forecasts to prepare better for your next action. Regardless of market conditions, we, here at Zacks, provide investors with unbiased guidance on how to beat the market.
As usual, Zacks Research guided investors over the past three months with its time-tested methodologies. Given the prevailing market uncertainty, you may want to look at our feats to prepare better for your next action.
Here are some of our key achievements:
Shares of Hecla Mining Company HL have gained 50.6% (versus the S&P 500’s 4.8% increase) since it was upgraded to a Zacks Rank #2 (Buy) on July 1.
Another stock, Shoals Technologies Group, Inc. SHLS, which was upgraded to a Zacks Rank #2 on July 7, has returned 19.7% (versus the S&P 500’s 3.6% increase) since then.
A hypothetical portfolio of Zacks Rank # 1 (Strong Buy) stocks returned +1.47% in 2025 (through August 4) vs. +5.60% for the S&P 500 index and +6.77% for the equal-weight version of the index.
This portfolio returned +22.4% in 2024, vs. +28% for the S&P 500 index and +19.9% for the equal-weight version of the S&P 500 index.
This hypothetical portfolio returned +20.65% in 2023 vs. +24.83% for the S&P 500 index and +15% for the equal-weight S&P 500 index.
The Zacks Model Portfolio – consisting of Zacks Rank #1 stocks – has outperformed the S&P index by more than 12 percentage points since 1988 (through August 4, 2025, the Zacks # 1 Rank stocks generated an annualized average return of +23.6% vs. +11.3% for the S&P 500 index).
You can see the complete list of today’s Zacks Rank #1 stocks here >>>
Check Hecla Mining Company’s historical EPS and Sales here>>>
Check Shoals Technologies’ historical EPS and Sales here>>>
Zacks Investment Research
Image Source: Zacks Investment Research
Shares of OPENLANE, Inc. KAR and GE Aerospace GE have advanced 16.7% (versus the S&P 500’s 4.1% increase) and 9.3% (versus the S&P 500’s 3.8% increase), since their Zacks Recommendation was upgraded to Outperform on July 16 and July 14, respectively.
While the Zacks Rank is our short-term rating system that is most effective over the one- to three-month holding horizon, the Zacks Recommendation aims to predict performance over the next 6 to 12 months. However, just like the Zacks Rank, the foundation for the Zacks Recommendation is trends in earnings estimate revisions.
The Zacks Recommendation classifies stocks into three groups — Outperform, Neutral and Underperform. While these recommendations are determined quantitatively, our analysts have the flexibility to override them for the 1100+ stocks they closely follow based on their better judgment of factors such as valuation, industry conditions and management effectiveness than the quantitative model.
To access our research reports with Zacks Recommendations for the 1100+ stocks we cover, click here>>>
Shares of Shopify Inc. SHOP, which belongs to the Zacks Focus List, have gained 31.8% over the past 12 weeks. The stock was added to the Focus List on September 6, 2022. Another Focus-List holding, Sea Limited SE, which was added to the portfolio on March 26, 2020, has returned 15.7% over the past 12 weeks. The S&P 500 has advanced by 8.1% over this period.
The 50-stock Focus List portfolio returned 10.91% in 2025 (through July 31, 2025) vs. +8.59% for the S&P 500 index and +5.84% for the equal-weight version of the index.
The Zacks Focus List portfolio returned +18.41% in 2024 vs. +25.04% for the S&P 500 index and +13% for the equal-weight S&P 500 index. The portfolio had returned +29.54% in 2023 vs. +26.28% for the S&P 500 index and +13.61% for the equal-weight S&P 500 index. In 2022, the portfolio returned -15.2% vs. the S&P 500 index’s -17.96%.
The portfolio leads the broader market over the preceding one, three, five and ‘since 2004’ periods. These annualized return comparisons are: +17.71% for the Focus List vs. +16.35% for the index over the one-year period, +19.21% vs. +17.101% over the 3-year period, +16.98% vs. +15.88% over the 5-year period, and +11.9% vs. +10.51% since 2004.
Unlock all of our powerful research, tools and analysis, including the Focus List, Zacks #1 Rank List, Equity Research Reports, Zacks Earnings ESP Filter, Premium Screener and more, as part of Zacks Premium. Gain full access now >>
AutoZone, Inc. AZO, a component of our Earnings Certain Admiral Portfolio (ECAP), has jumped 13.5% over the past 12 weeks. Mettler-Toledo International Inc. MTD has followed AutoZone with 10.3% returns.
The Zacks Earnings Certain Admiral Portfolio (ECAP), which consists of 30 concentrated, ultra-defensive, long-term Buy-and-Hold stocks, returned +0.20% in the second quarter of 2025 vs. the S&P 500 index’s +10.94% gain (SPY ETF). In the year-to-date period through June 30, the portfolio returned +3.93% vs. +6.20% gain for the S&P 500 index.
For the year 2024, the portfolio returned +16.26% vs. +24.89% for the S&P 500 index (SPY ETF).
In 2023, the portfolio returned +12.17% vs. +26.28% for the S&P 500 index. The portfolio returned -4.7% in 2022 vs. the S&P 500 index’s -17.96%.
With little to no turnover and annual rebalance periodicity, ECAP seeks to minimize capital loss by holding shares of companies whose earnings streams exhibit a proven 20+ year track record of surviving recessionary periods with minimal impact on aggregate earnings growth relative to the overall S&P 500.
The ECAP and many other model portfolios are available as part of Zacks Advisor Tools, a cloud-based solution to access Zacks award-winning stock, mutual fund and ETF research. Click here to schedule a demo.
Johnson & Johnson JNJ, which is part of our Earnings Certain Dividend Portfolio (ECDP), has returned 15.1% over the past 12 weeks. Another ECDP stock, The Home Depot, Inc. HD, has increased 14.1% over the same time frame. Of course, the inclination of investors toward quality dividend stocks to secure an income stream amid heightened market volatility contributed to this performance.
Check Johnson & Johnson’s dividend history here>>>
Check Home Depot’s dividend history here>>>
With an extremely low beta and a history of minimum earnings variability over the last 20+ years, this 25-stock portfolio helps to significantly mitigate risk.
The Zacks Earnings Certain Dividend Portfolio (ECDP) returned -3.17% in 2025 Q2 vs. the S&P 500 index’s +10.94% gain and the Dividend Aristocrats ETF’s (NOBL) -0.09% return. Year-to-date (through June 30), the portfolio returned +2.38% vs. +2.18% gain for the Dividend Aristocrat ETF.
For full-year 2024, the portfolio has returned +6.95% vs. +24.89% for the S&P 500 index and +6.72% for NOBL.
The portfolio returned -0.9% in 2023 vs. +26.28% for the S&P 500 index and +8.11% for NOBL. The portfolio returned -2.3% in 2022 vs. -17.96% for the S&P 500 index and -8.34% for NOBL.
Click here to access this portfolio on Zacks Advisor Tools.
Stride, Inc. LRN, from the Zacks Top 10 Stocks for 2025, has jumped 54.7% year to date compared with the S&P 500 index’s 10.5% increase.
The Top 10 portfolio returned +16.9% this year (through the end of July 2025) vs. +8.6% for the S&P 500 index and +5.8% for the equal-weight version of the index.
The Top 10 portfolio returned +62.98% in 2024, vs. +25.04% for the S&P 500 index and +13% for the equal-weight version of the index. The portfolio had returned +25.15% in 2023 vs. +26.28% for the S&P 500 index.
Since 2012, the Top 10 portfolio has produced a cumulative return of +2,220.4% through the end of July 2025 vs. +517.8% for the S&P 500 index and +378% for the equal-weight version of the index. The portfolio has produced an average return of +26.1% in the period 2012 through July 31, 2025, vs. +14.4% for the S&P 500 index and +12.2% for the equal-weight version of the index.
Want the latest recommendations from Zacks Investment Research? Today, you can download 7 Best Stocks for the Next 30 Days. Click to get this free report
This article first appeared on GuruFocus. Sep 11 – Opendoor (NASDAQ:OPEN) shares jump about 30% in early Thursday trading after the company names Kaz Nejatian as CEO and brings co-founder Keith Rabois back as chairman. The move follows last month’s resignation of Carrie Wheeler amid investor pressure and a period of intense retail interest that
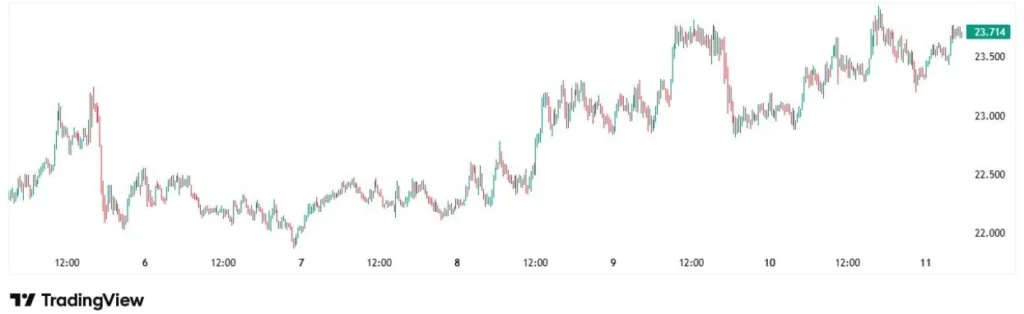
Created on September 11, 2025 The Chainlink (LINK) token has steadily gained over the past week, and despite resistance capping its upside, buyers remain firmly in control of the broader trend. LINK Price Steady After Recent Gains Chanlink price chart | Source: Tradingview In the last 24 hours, LINK has traded between $23.18 and $23.87,
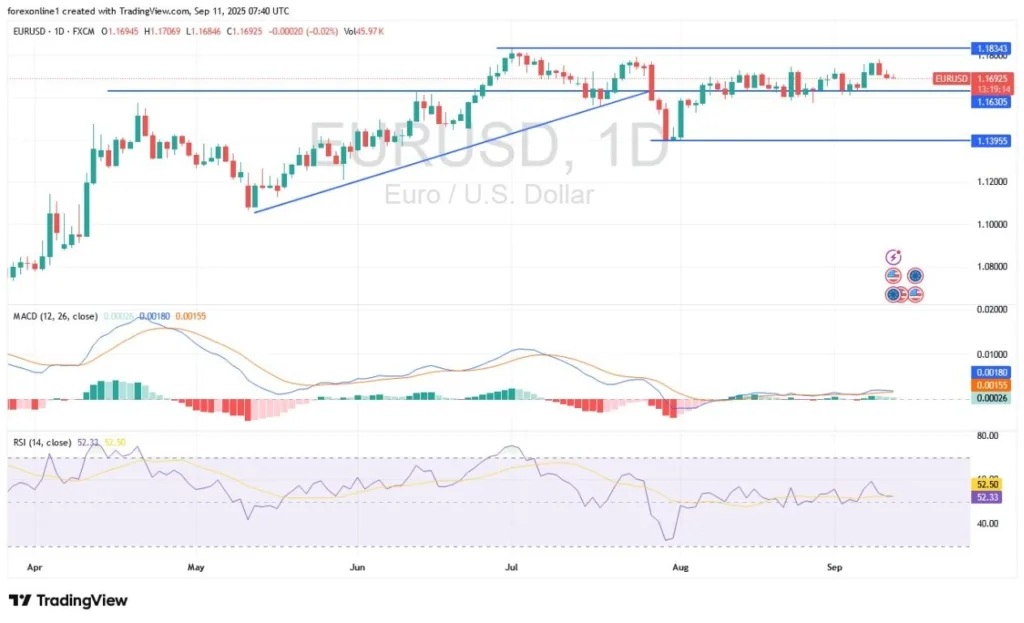
Created on September 11, 2025 EUR/USD Analysis Summary Today Overall Trend: Cautiously neutral. Support Levels: 1.1660 – 1.1600 – 1.1540 Resistance Levels: 1.1750 – 1.1810 – 1.1880 EUR/USD Trading Signals: Buy: Buy EUR/USD from the support level of 1.1580, with a target of 1.1800 and a stop-loss at 1.1500. Sell: Sell EUR/USD from the resistance
Data showig a fall in producer prices last month came ahead of key consumer figures due Thursday and boosted rate cut hopes (Frederic J. BROWN) Asian equities mostly rose Thursday as investors built on this week’s rally after US data ramped up expectations for a string of interest rate cuts. Markets have enjoyed a healthy
Oracle’s (ORCL) massive backlog for its cloud business stunned Wall Street and cemented the company’s role as a key player in the AI market, lifting hopes that the broader AI-fueled tech rally has more room to run. Oracle said late Tuesday that its “RPO,” or remaining performance obligations, a measure of future revenue from customer
09/10/2025 – 05:30 PM
Newmont to Maintain Listings on the NYSE, ASX and PNGX Exchanges DENVER–(BUSINESS WIRE)– Newmont Corporation (NYSE: NEM, TSX: NGT, ASX: NEM, PNGX: NEM) (“Newmont” or the “Company”) announces that it has
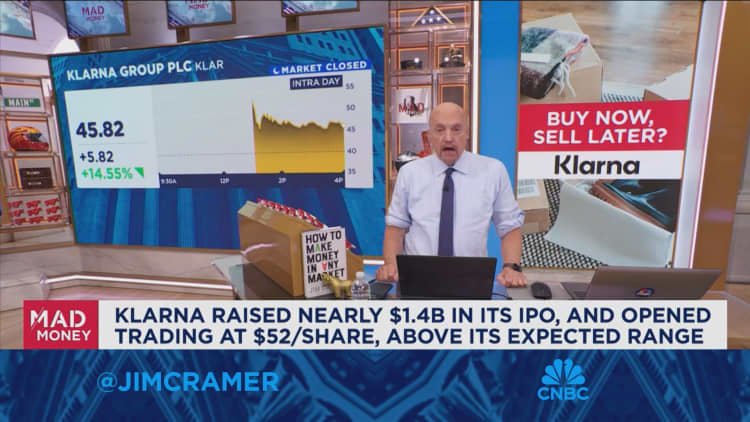
CNBC’s Jim Cramer explained why he thinks newly-minted IPO Klarna is a buy even after shares climbed during its first trading session. “While Klarna roared right out of the gate, the stock hasn’t gone to an insane valuation yet. I think the numbers look good, so I think it can be bought at these levels,”
Two decades after its founding, Klarna has gone public, and its investors are finally seeing a windfall. The Swedish “buy now, pay later” company listed on the New York Stock Exchange on Wednesday. Its stock popped 30% on its debut, jumping above its $40-per-share IPO price to $52 a share. That IPO price gave Klarna