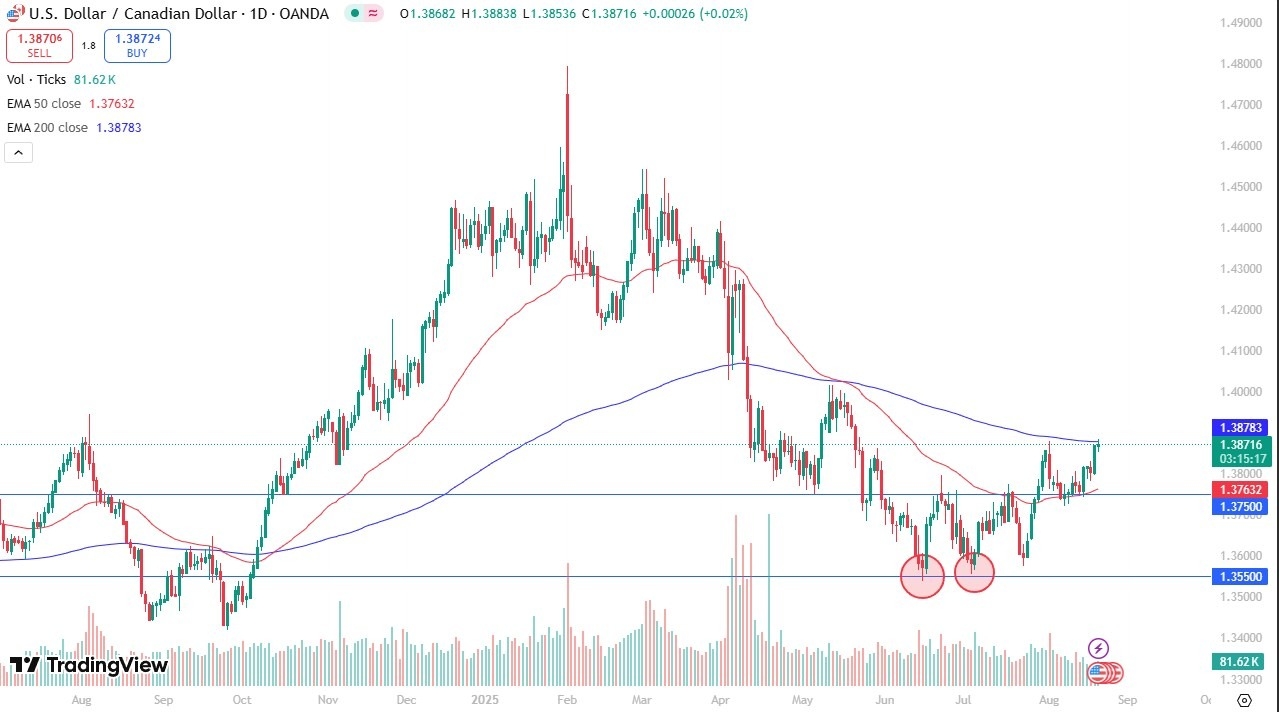
Hangs Out Near 200 Day EMA (Video)

Potential signal:

  • I am still bullish of this pair, and on a break of the 200 Day EMA, I am still buying with a stop at 1.38 and a target of 1.3990 area.

It’s been a pretty quiet trading session during Wednesday as the US dollar has gone both higher and lower against the Canadian dollar in a really tight range. It’s worth noting that we are sitting at the 200 day EMA indicator. And that of course offers a lot of technical noise. If we can break above the 200 day EMA, then it’s possible that we could go looking at the 1.40 level.

A pullback from here is very possible and that could open up a move down to the 1.38 level, possibly even the 50 day EMA, which sits just above the 1.3750 level. As long as we can stay above there, I think we’ve got a real shot at going higher given enough time.

USD/CAD Signal 21/08: Hangs Out Near 200 Day EMA (graph)

No Trade Agreement Between Countries

It does make a certain amount of sense considering that the United States and Canada still do not have any type of trade agreement that hurts Canada in a much more outsized way than it hurts the United States. And ultimately this is a scenario where I think if there’s a lot of fear around the world anyway, then the US dollar becomes more attractive in normal conditions, let alone what’s going on right now. Short term pullbacks continue to be buying opportunities. I have no interest in shorting this market. And of course, the interest rate differential continues to favor the US dollar. Really at this point in time, until we make a fresh new low below the 1.3550 level, I just don’t really want to short. I do think that we will rally eventually, and we may actually end up rallying for quite some time. At this point, I think it is probably just a matter of time before we take off.

Ready to trade our Forex USD/CAD predictions? Here are the best Canadian online brokers to start trading with.

Christopher Lewis has been trading Forex and has over 20 years experience in financial markets. Chris has been a regular contributor to Daily Forex since the early days of the site. He writes about Forex for several online publications, including FX Empire, Investing.com, and his own site, aptly named The Trader Guy. Chris favours technical analysis methods to identify his trades and likes to trade equity indices and commodities as well as Forex. He favours a longer-term trading style, and his trades often last for days or weeks.

Source link

Visited 1 times, 1 visit(s) today

Related Article

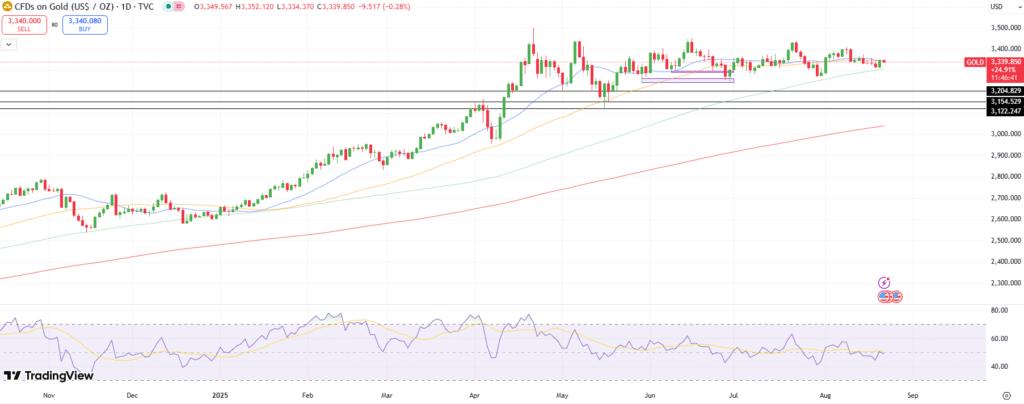
Gold price technical analysis

Gold Price Holds Weak Tone Amid Fed, Geopolitical Risk

Gold price stays subdued with limited downside. Fed policy signals weighed on the gold as bets for aggressive easing faded. Markets now eye the Fed Chair speech and the Jackson Hole Symposium. Gold price stays under pressure in the early European session on Thursday with limited downside, as investors weigh Fed policy signals against persistent

EUR/GBP Weekly Outlook - Action Forex

NZD/USD Holds Near Four-Month Low

As today’s NZD/USD chart shows, the pair is trading near a four-month low following a sharp decline. The drop occurred yesterday after the Reserve Bank of New Zealand cut the official cash rate by 25 basis points to a three-year low of 3.0% and indicated that the rate could fall further to 2.55% by May

ForexIGO Coordinates Gold and GBP/USD in One Ruleset

ForexIGO Coordinates Gold and GBP/USD in One Ruleset

By DailyForex Press Release Created on August 21, 2025 MT4 Expert Advisor for XAUUSD and GBPUSD on M30; pattern-led entries confirmed by trend and momentum, with demo available. Quick View Limassol, Cyprus – August 2025 – ForexIGO unifies gold (XAUUSD) and GBPUSD within a single, structured approach on MetaTrader 4. It detects actionable patterns, validates

A stock price chart shown in red.

The Stock Market Has a Serious Problem (Besides President Trump’s Tariffs). History Says This Will Happen Next.

President Trump’s tariffs have tipped the economy toward stagflation, but investors have another serious problem in the stock market’s elevated valuation. U.S. stocks have been unusually volatile this year. The benchmark S&P 500 (^GSPC -0.24%) dropped more than 10% in two days in early April after President Trump outlined sweeping “Liberation Day” tariffs. Those rapid

USD/ILS Analysis 21/08: Climb Up Develops (Chart)

USD/ILS Analysis 21/08: Climb Up Develops (Chart)

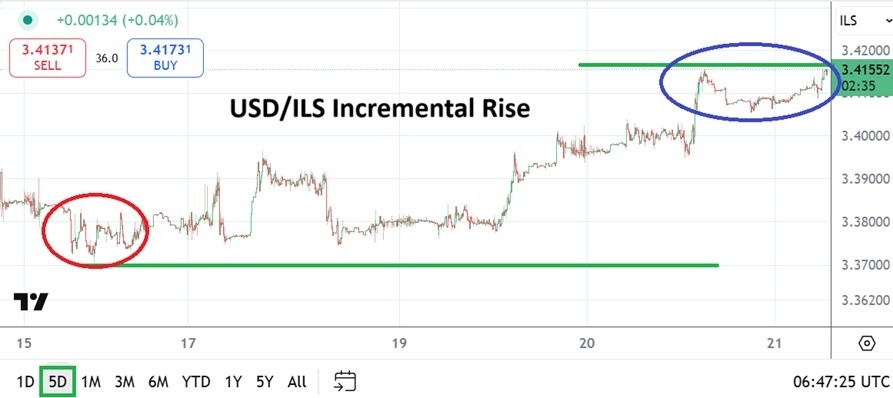
Created on August 21, 2025 The USD/ILS is near 3.41600 as of this writing as relatively fast bids and asks are being displayed with a wide spread, which makes it rather dangerous for day traders to pursue the currency pair. The USD/ILS has incrementally climbed the past week, having waved goodbye to lows around 3.37550,

BTC/USD Forex Signal 21/08: More Bitcoin Sell-Off (Chart)

BTC/USD Forex Signal 21/08: More Bitcoin Sell-Off (Chart)

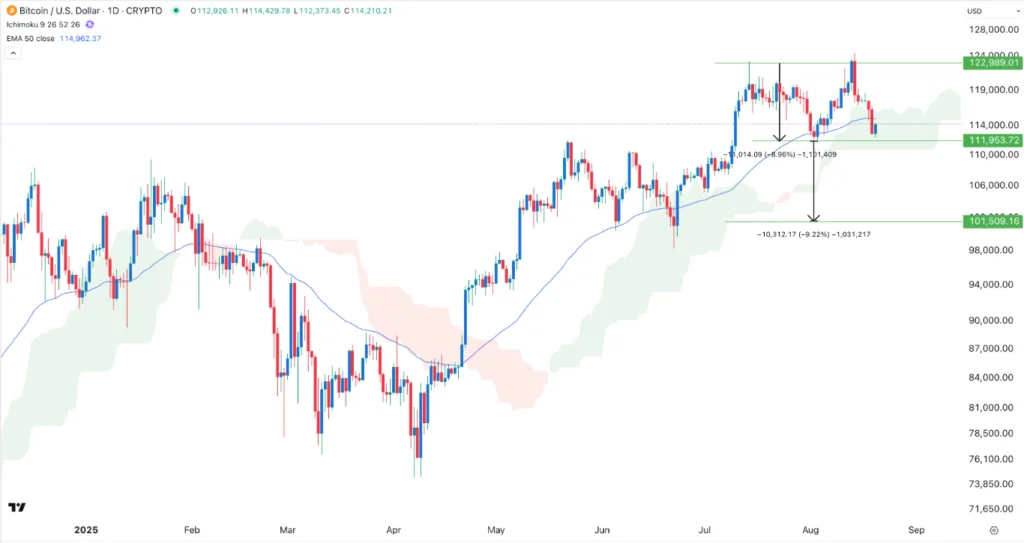
Created on August 21, 2025 Bearish view Sell the BTC/USD pair and set a take-profit at 110,000. Add a stop-loss at 118,000. Timeline: 1-2 days. Bullish view Buy the BTC/USD pair and set a take-profit at 118,000. Add a stop-loss at 110,000. The BTC/USD exchange rate crashed to a key support level as institutional demand

EUR/USD Forex Signal 21/08: Strong Bullish Breakout (Chart)

EUR/USD Forex Signal 21/08: Strong Bullish Breakout (Chart)

Created on August 21, 2025 Bullish view Buy the EUR/USD pair and set a take-profit at 1.1750. Add a stop-loss at 1.1550. Timeline: 1-2 days Bearish view Sell the EUR/USD pair and set a take-profit at 1.1550. Add a stop-loss at 1.1750 The EUR/USD pair was flat on Thursday, continuing a consolidation that has been

EUR/GBP Weekly Outlook - Action Forex

NZ trade swings back into deficit despite broad export gains

New Zealand’s trade balance flipped back into deficit in July, with imports outpacing exports despite solid overseas demand. Goods exports climbed 10% yoy to NZD 6.7 billion, but imports rose 2.6% yoy to NZD 7.3 billion, leaving a monthly deficit of NZD -578 million compared with expectation of NZD 70 million surplus. Export performance was