The following is a guest editorial courtesy of Carolane de Palmas, Markets Analyst at Retail FX and CFDs broker ActivTrades.
Gold has delivered a standout performance in the first half of 2025, recording its strongest mid-year rally since 2007. According to data from ActivTrades, the precious metal has surged over 25% year-to-date, currently trading near $3,337 an ounce. The rally was fueled in large part by a series of record highs in April, when gold prices briefly exceeded $3,499 an ounce, setting a new all-time peak.
As reported by The Wall Street Journal, this marks gold’s best half-year performance in nearly two decades, surpassing even the post-financial crisis momentum seen in the early 2010s. In the second quarter ending June 30, gold still managed to gain more than 5.5%, capping off seven consecutive months of price increases—although May and June were notably more subdued, with prices largely consolidating.
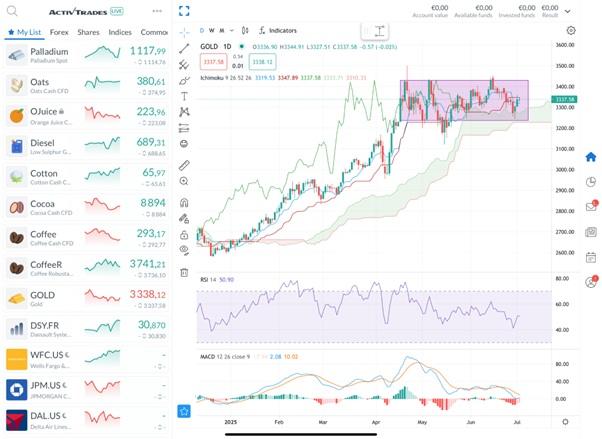
Gold Daily Chart – Source: ActivTrades
A look at the daily chart on the ActivTrader platform shows that gold has entered a period of consolidation since peaking at the end of April. The commodity has been trading sideways, confined within a range defined by a resistance zone near $3,431 and support around $3,240. Technically, the Relative Strength Index (RSI) is hovering close to the neutral 50 level after gradually declining since the peak, indicating a temporary pause in directional momentum as markets digest recent gains.
While gold remains firmly supported by long-term bullish factors, the current price action suggests traders are awaiting fresh catalysts to determine the next leg. In the sections below, we will explore what’s behind gold’s explosive rise so far this year, the macroeconomic forces at play, and whether the yellow metal still has room to run in the second half of 2025.
What’s Next for Gold? Weighing the Upside Against Lingering Uncertainty
While gold continues to benefit from a strong foundation of long-term bullish drivers, its near-term trajectory remains less clear. After a powerful surge in the first half of 2025, many market participants appear to be waiting for a fresh catalyst before pushing prices significantly higher.
Analysts at BMI, a unit of Fitch Solutions, suggest that gold’s rally may be losing steam—at least temporarily. Still, they maintain that the precious metal remains well supported, thanks to a combination of ongoing geopolitical tensions, uncertainty surrounding global trade, central bank buying, and a persistently weaker U.S. dollar.
The recent escalation between Israel and Iran provided yet another reminder of gold’s value as a geopolitical hedge. In times of international conflict or political instability, investors tend to seek the safety and neutrality that gold offers. This is part of a broader trend in which traditional monetary drivers—such as real interest rates and inflation expectations—are being overtaken by non-monetary forces.
From 2008 through early 2022, gold typically moved inversely to real yields, functioning as a hedge against low interest rates or rising inflation. But since Russia’s invasion of Ukraine, that relationship has weakened significantly. Gold has continued to rise even as real yields remain elevated, suggesting that new dynamics are now influencing the market.
Today, factors such as reserve diversification by central banks, efforts to avoid dollar-based financial systems, and rising geopolitical tensions have taken center stage. For many countries—particularly in the emerging world—gold is no longer just an inflation hedge but a strategic store of value. Its lack of counterparty risk and political neutrality make it especially appealing in an era where finance itself is increasingly being used as a geopolitical tool.
Another important driver of gold’s recent strength has been aggressive central bank buying.
In 2024, central banks purchased over 1,000 tonnes of gold, double the average of the previous decade, lifting global official reserves to a record 36,000 tonnes. This buying has been concentrated in emerging economies such as China, Turkey, and India, which together have added more than 600 tonnes since late 2021. These nations are clearly seeking to reduce their reliance on reserve currencies like the U.S. dollar and are turning to gold as a more neutral and reliable alternative.
Despite all this, breaking through the previous record high would still require a significant catalyst. According to BMI, a major escalation in Middle Eastern conflict or a large, unexpected interest rate cut from the Federal Reserve would likely be necessary to drive prices significantly higher. However, the Fed has remained cautious. Chair Jerome Powell recently suggested that interest rates might have already been lowered were it not for the fiscal and policy volatility introduced by President Trump’s administration.
For now, BMI is maintaining its 2025 average gold price forecast at $3,100 per ounce, below current levels.
Meanwhile, investors are shifting some of their focus toward silver, which has surged alongside gold but is also benefiting from its strong industrial demand profile. In June 2025, silver prices hit their highest level since 2011, climbing to around $37.29 per ounce, marking a 25% gain year-to-date. This follows a robust 2024, during which prices rose by an average of 21%. Unlike gold, silver’s value is closely linked to its use in electronics, renewable energy, and chip-intensive technologies, sectors that are booming due to AI-related demand and green infrastructure investment.
According to the latest World Silver Survey, industrial demand for silver rose for the fourth consecutive year in 2024, reaching 680.5 million ounces, a 4% annual increase. Much of this growth was driven by the solar sector, where China’s aggressive expansion in solar cell manufacturing has sharply increased silver usage.
As we move into the second half of 2025, gold remains well positioned thanks to persistent macro and geopolitical uncertainties. But without a clear short-term catalyst, its next bullish move may depend more on external shocks than steady momentum. Silver, on the other hand, could continue to outperform if industrial demand remains strong, offering investors an interesting complement to traditional precious metals exposure.
The information provided does not constitute investment research. The material has not been prepared in accordance with the legal requirements designed to promote the independence of investment research and as such is to be considered to be a marketing communication.
All information has been prepared by ActivTrades (“AT”). The information does not contain a record of AT’s prices, or an offer of or solicitation for a transaction in any financial instrument. No representation or warranty is given as to the accuracy or completeness of this information.
Any material provided does not have regard to the specific investment objective and financial situation of any person who may receive it. Past performance is not a reliable indicator of future performance. AT provides an execution-only service. Consequently, any person acting on the information provided does so at their own risk. Forecasts are not guarantees. Regulated status does not guarantee safety.