Today’s Gold Analysis Overview:
- The overall Gold Trend: Strongly bullish.
- Today’s Gold Support Levels: $3,378 – $3,360 – $3,300 per ounce.
- Today’s Gold Resistance Levels: $3,415 – $3,440 – $3,480 per ounce.
")
Today’s Gold Trading Signals:
- Sell gold from the resistance level of $3,435, with a target of $3,320 and a stop loss of $3,460.
- Buy gold from the support level of $3,330, with a target of $3,420 and a stop loss of $3,300
Technical Analysis of Gold Price (XAU/USD) Today:
Despite the strong upward movement in gold prices at the end of the week, with gains towards the $3,410 per ounce resistance, gold futures contracts pulled back from their record levels on Friday. The initial rally was fueled by confusion over new US tariffs on gold imports. According to performance across gold trading platforms, gold futures rose to $3,458.00 per ounce, and had even reached a high of $3,534.20 before giving up most of their gains. Nevertheless, the gold price index recorded a weekly gain of over 3%, bringing its year-to-date gains to over 30%.
In a similar performance, silver prices also rose slightly to end the trading week. Silver futures climbed to $38.455 per ounce, resulting in a weekly gain of 4.5% and a yearly increase of over 31%.
Trading Tips:
Traders advise buying gold during every price decline, not buying during record highs, and not taking risks, no matter how strong the gold trading opportunities.
US Tariffs and the Gold Market
According to performance on trusted trading platforms, gold futures prices rose sharply on Friday following reports that the US government would impose tariffs on imported gold bars. The Financial Times had created chaos in the metals market by publishing a letter dated July 31 from US Customs and Border Protection, which stated that 100-ounce and 1-kilogram gold bars would be reclassified under a customs code that imposes tariffs.
Earlier this week, US President Donald Trump imposed a 39% tax on Swiss exports to the United States. Switzerland is the world’s largest gold producer. Meanwhile, the Swiss Precious Metals Association warned that US tariffs on gold bullion would disrupt international trade flows. However, the White House denied these reports, describing them as “misinformation.” A White House official told CNBC, “The White House intends to issue an executive order soon to clarify misinformation about imposing tariffs on gold bullion and other specialty products.”
China’s Gold Bullion Purchases Support Prices
Recently, both gold and silver prices have risen to two-week highs, supported by news that the People’s Bank of China continues to increase its gold reserves. In addition to positive short-term technical forecasts for both gold and silver, this has encouraged demand for the two metals. According to official figures, the People’s Bank of China increased its gold reserves in July for a ninth consecutive month of purchases, as it diversifies its investments away from the US dollar. Bloomberg reported that the central bank’s gold reserves increased by 60,000 troy ounces, reaching 73.96 million troy ounces last month. This brings total purchases since last November to about 36 tons.
As is widely known, central bank purchases, including those by China, are one of the main factors behind gold’s 30% price increase this year. While the central bank buying spree is expected to continue, the pace has slowed as gold prices have risen.
Another factor that will impact the gold market is the Kremlin’s announcement that Presidents Vladimir Putin and Donald Trump will meet for summit talks in the coming days. Bloomberg quoted Yuri Ushakov, a foreign policy aide to the Kremlin, as telling reporters that Russia and the US have agreed on the meeting location and “we have started, in cooperation with our American colleagues, to work on specific issues,” with the goal of holding talks this week. The announcement came a day after Putin met with Trump’s envoy, Steve Witkoff, at the Kremlin for nearly three hours, as the US seeks to end Russia’s war in Ukraine. Trump has threatened to impose secondary tariffs on Russian oil buyers unless Putin agrees to a ceasefire with Ukraine.
Technical Levels for the Gold Market Today:
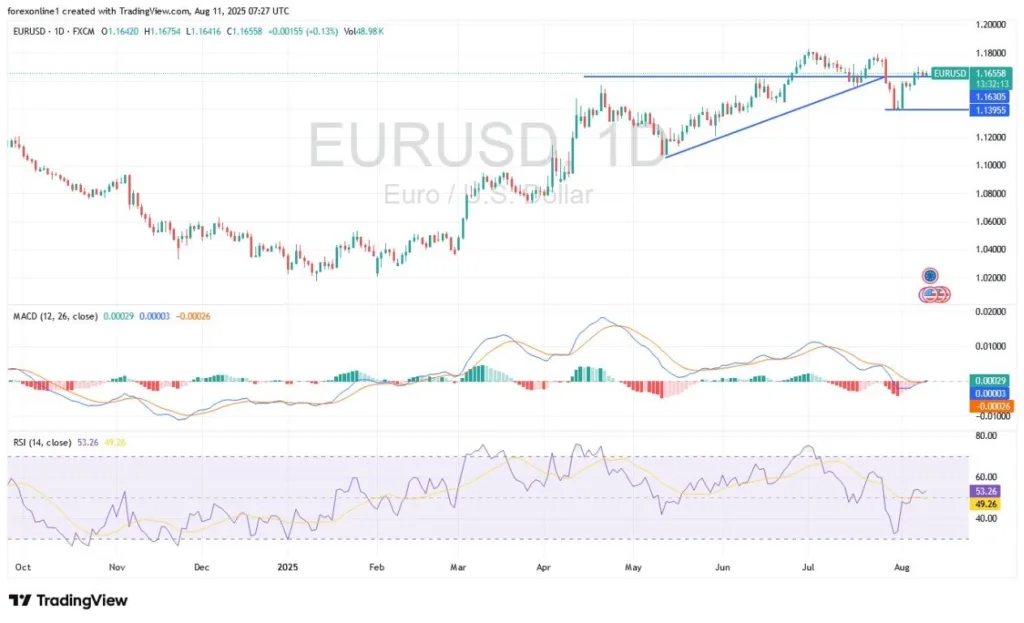
According to the daily timeframe chart, the recent rebound in gold’s spot prices has pushed the 14-day RSI (Relative Strength Index) to a reading of 57. Technically, this supports bulls as they prepare for stronger upward breakouts. At the same time, the MACD (Moving Average Convergence Divergence) indicator is preparing to turn higher. Finally, psychological resistance of $3,500 per ounce will remain a legitimate target for bulls if the current factors supporting gold’s gains persist.
Ready to trade our Gold price forecast? We’ve made a list of the best Gold trading platforms worth trading with.