Gold Price Holds Weak Tone Amid Fed, Geopolitical Risk

  • Gold price stays subdued with limited downside.
  • Fed policy signals weighed on the gold as bets for aggressive easing faded.
  • Markets now eye the Fed Chair speech and the Jackson Hole Symposium.

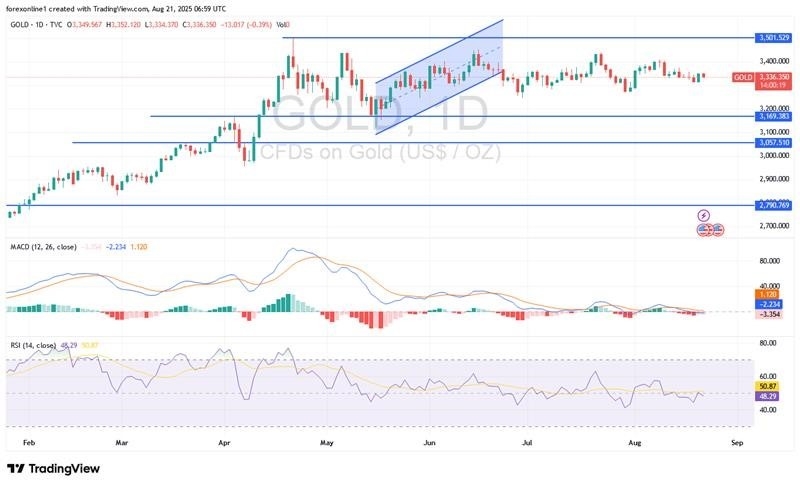
Gold price stays under pressure in the early European session on Thursday with limited downside, as investors weigh Fed policy signals against persistent geopolitical risks. The precious metal trades near recent lows, failing to build on Monday’s rebound as the greenback soars to a one-and-a-half-week high.

Are you interested to learn more about forex options trading? Check our detailed guide-

The US dollar’s strength stems from diminishing expectations of aggressive easing policy. FOMC meeting minutes of July revealed a broad support for keeping the rates steady, as most policymakers anticipate an upside risk in inflation. It shows the central bank is cautious on the rate cuts, drawing flows from non-yielding gold into the dollar.

However, the dollar bulls remain non-committed ahead of economic data, the Fed Chair’s speech, and the Jackson Hole Symposium. The uncertainty around the Fed’s next move has helped the gold buyers as safe-haven demand rises amid cautious market sentiment.

Geopolitical developments also keep the demand for gold underpinned. Russian Foreign Minister Sergey Lavrov said that peace talks with Ukraine without Russia will lead nowhere. Moreover, political tension in the US after President Trump asked for the resignation of Fed Governor Lisa Cook has again raised concerns over the central bank’s independence. Hence, dollar gains remain capped.

Gold’s Key Events to Watch

Looking forward, market participants are eying the US flash PMI data to find signals about economic momentum. Moreover, weekly jobless claims and Philly Fed Manufacturing Index will also provide short-term directional bias.

Are you interested to learn more about forex tools? Check our detailed guide-

Gold price technical analysis: Bulls lacking conviction

Gold price technical analysisGold price technical analysis
Gold 4-hour chartgold

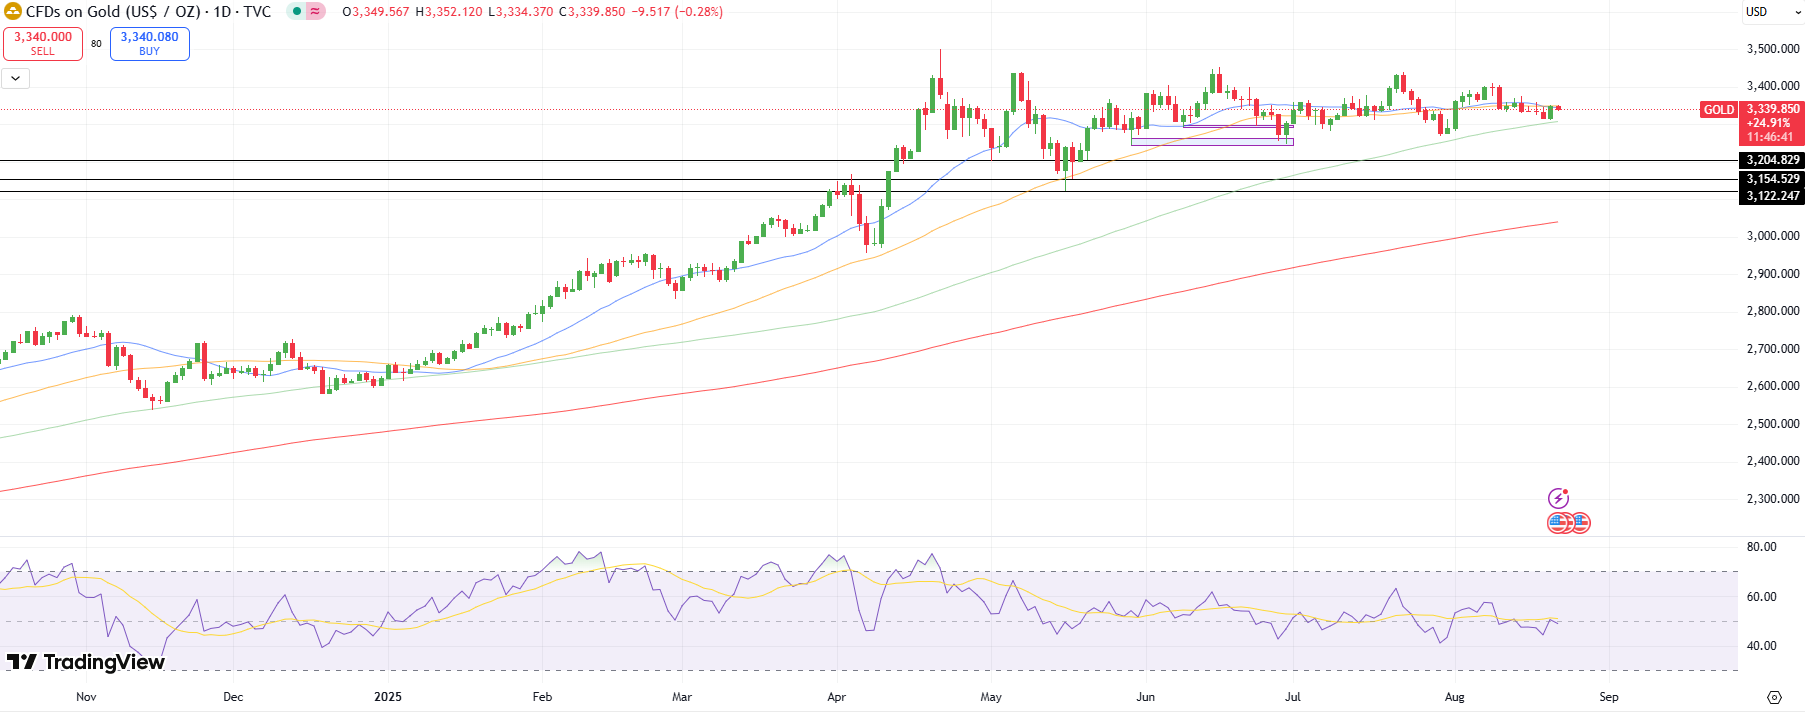
The 4-hour chart for gold remains ranging within $3,250 to $3,440, with no apparent technical bias near the mid-$3,300 level. The 20- and 50-period MAs signal a bearish move towards the $3,300 area. The RSI wobbles near the 50.0 level, lacking directional momentum, which suggests the price could keep ranging around current levels.  Breaking the zone could open the door to $3,200. On the upside, the upper range at $3,440 appears as a strong resistance ahead of all-time highs around $3,500.

Looking to trade forex now? Invest at eToro!

67% of retail investor accounts lose money when trading CFDs with this provider. You should consider whether you can afford to take the high risk of losing your money.

Source link

Visited 1 times, 1 visit(s) today

Related Article

EUR/USD Analysis 21/08: Key Economic Readings (Chart)

EUR/USD Analysis 21/08: Key Economic Readings (Chart)

Created on August 21, 2025 EUR/USD Analysis Summary Today Overall Trend: Neutral with a downward bias. Today’s Support Levels: 1.1600 – 1.1550 – 1.1480. Today’s Resistance Levels: 1.1680 – 1.1730 – 1.1800. EUR/USD Trading Signals: Buy EUR/USD from the 1.1560 support level, with a target of 1.1800 and a stop-loss at 1.1500. Sell EUR/USD from

Goldman Traders Say It’s Time to Buy the Dip in Momentum Stocks

(Bloomberg) — Sharp losses in high-flying momentum stocks may present a dip-buying opportunity if history is any guide, according to Goldman Sachs Group Inc.’s trading desk. The traders cited rebounds after similar prior losses in Goldman’s High Beta Momentum basket, coupled with the current technical setup. Most Read from Bloomberg When the long-short momentum basket

Gold Analysis 21/08: USD Recovery Increases Losses (Chart)

USD Recovery Increases Losses (Chart)

Created on August 21, 2025 Today’s Gold Analysis Overview: The overall Gold Trend: Neutral with a downward bias. Gold Support Levels Today: $3310 – $3270 – $3220 per ounce. Gold Resistance Levels Today: $3360 – $3350 – $3410 per ounce. Today’s Gold Trading Signals: Buy gold from the $3290 support level, with a target of

AUD/USD technical forecast

AUD/USD Forecast Extends Losses as Traders Await Jackson Hole

AUD/USD forecast remains subdued amid sour risk sentiment. Fed meeting minutes show no hint of aggressive easing. Australian PMI data shows a surge in economic activity The AUD/USD forecast remains bearish on Thursday as the pair slides to 0.6420 during the European session. The price stays around the weakest level in two months after posting

Short sellers reap over $5 billion on Big Tech bets as AI fears roil market

Short sellers betting against some of the market’s leading AI stocks potentially made billions as markets slid this week and investors moved away from some of the year’s hottest tech trades. On Wednesday, tech stocks stumbled for a second day, with the tech-heavy Nasdaq Composite’s (^IXIC) 0.7% drop leading declines in the major averages as

GBP/USD Forex Signal: Bearish Pressure Builds (Chart)

GBP/USD Forex Signal: Bearish Pressure Builds (Chart)

Created on August 21, 2025 Bearish view Sell the GBP/USD pair and set a take-profit at 1.3350. Add a stop-loss at 1.3585. Timeline: 1-2 days. Bullish view Buy the GBP/USD pair and set a take-profit at 1.3585. Set a take-profit at 1.3350. The GBP/USD exchange rate pulled back for three consecutive days, even as the

NZD/USD Analysis Today 21/08: Bears in Control (Chart)

NZD/USD Analysis Today 21/08: Bears in Control (Chart)

Created on August 21, 2025 Price velocity downwards was sparked in the NZD on late Tuesday, and lows have been demonstrated the past day as the 0.58190 vicinity continues to be tested. The NZD/USD has shown a tendency to display bearish behavior the past couple of months. The selling action has not been a stable