Gold Declines as EU Strikes Trade Deal

Gold held steady at $3,330 per troy ounce on Monday following three consecutive days of declines. The metal faced downward pressure after news emerged of a trade agreement between the US and the EU, dampening investor interest in safe-haven assets.

On Sunday, the US and EU reached a broad trade deal, which includes a 15% tariff on most European goods, alongside commitments to invest hundreds of billions of dollars in American industry. This agreement mirrors last week’s US–Japan trade pact in structure.

Traders are now bracing for a busy week of economic events, with the Federal Reserve meeting at the centre of attention. While interest rates are expected to remain unchanged, markets will scrutinise any signals about a potential rate cut in September.

Key US labour market data will also be in focus, including JOLTS reports, ADP employment figures, and the crucial nonfarm payrolls release. Equally significant will be the PCE price index – the Fed’s preferred inflation gauge – which will indicate whether price pressures are intensifying amid new tariffs.

Technical Analysis: XAU/USD
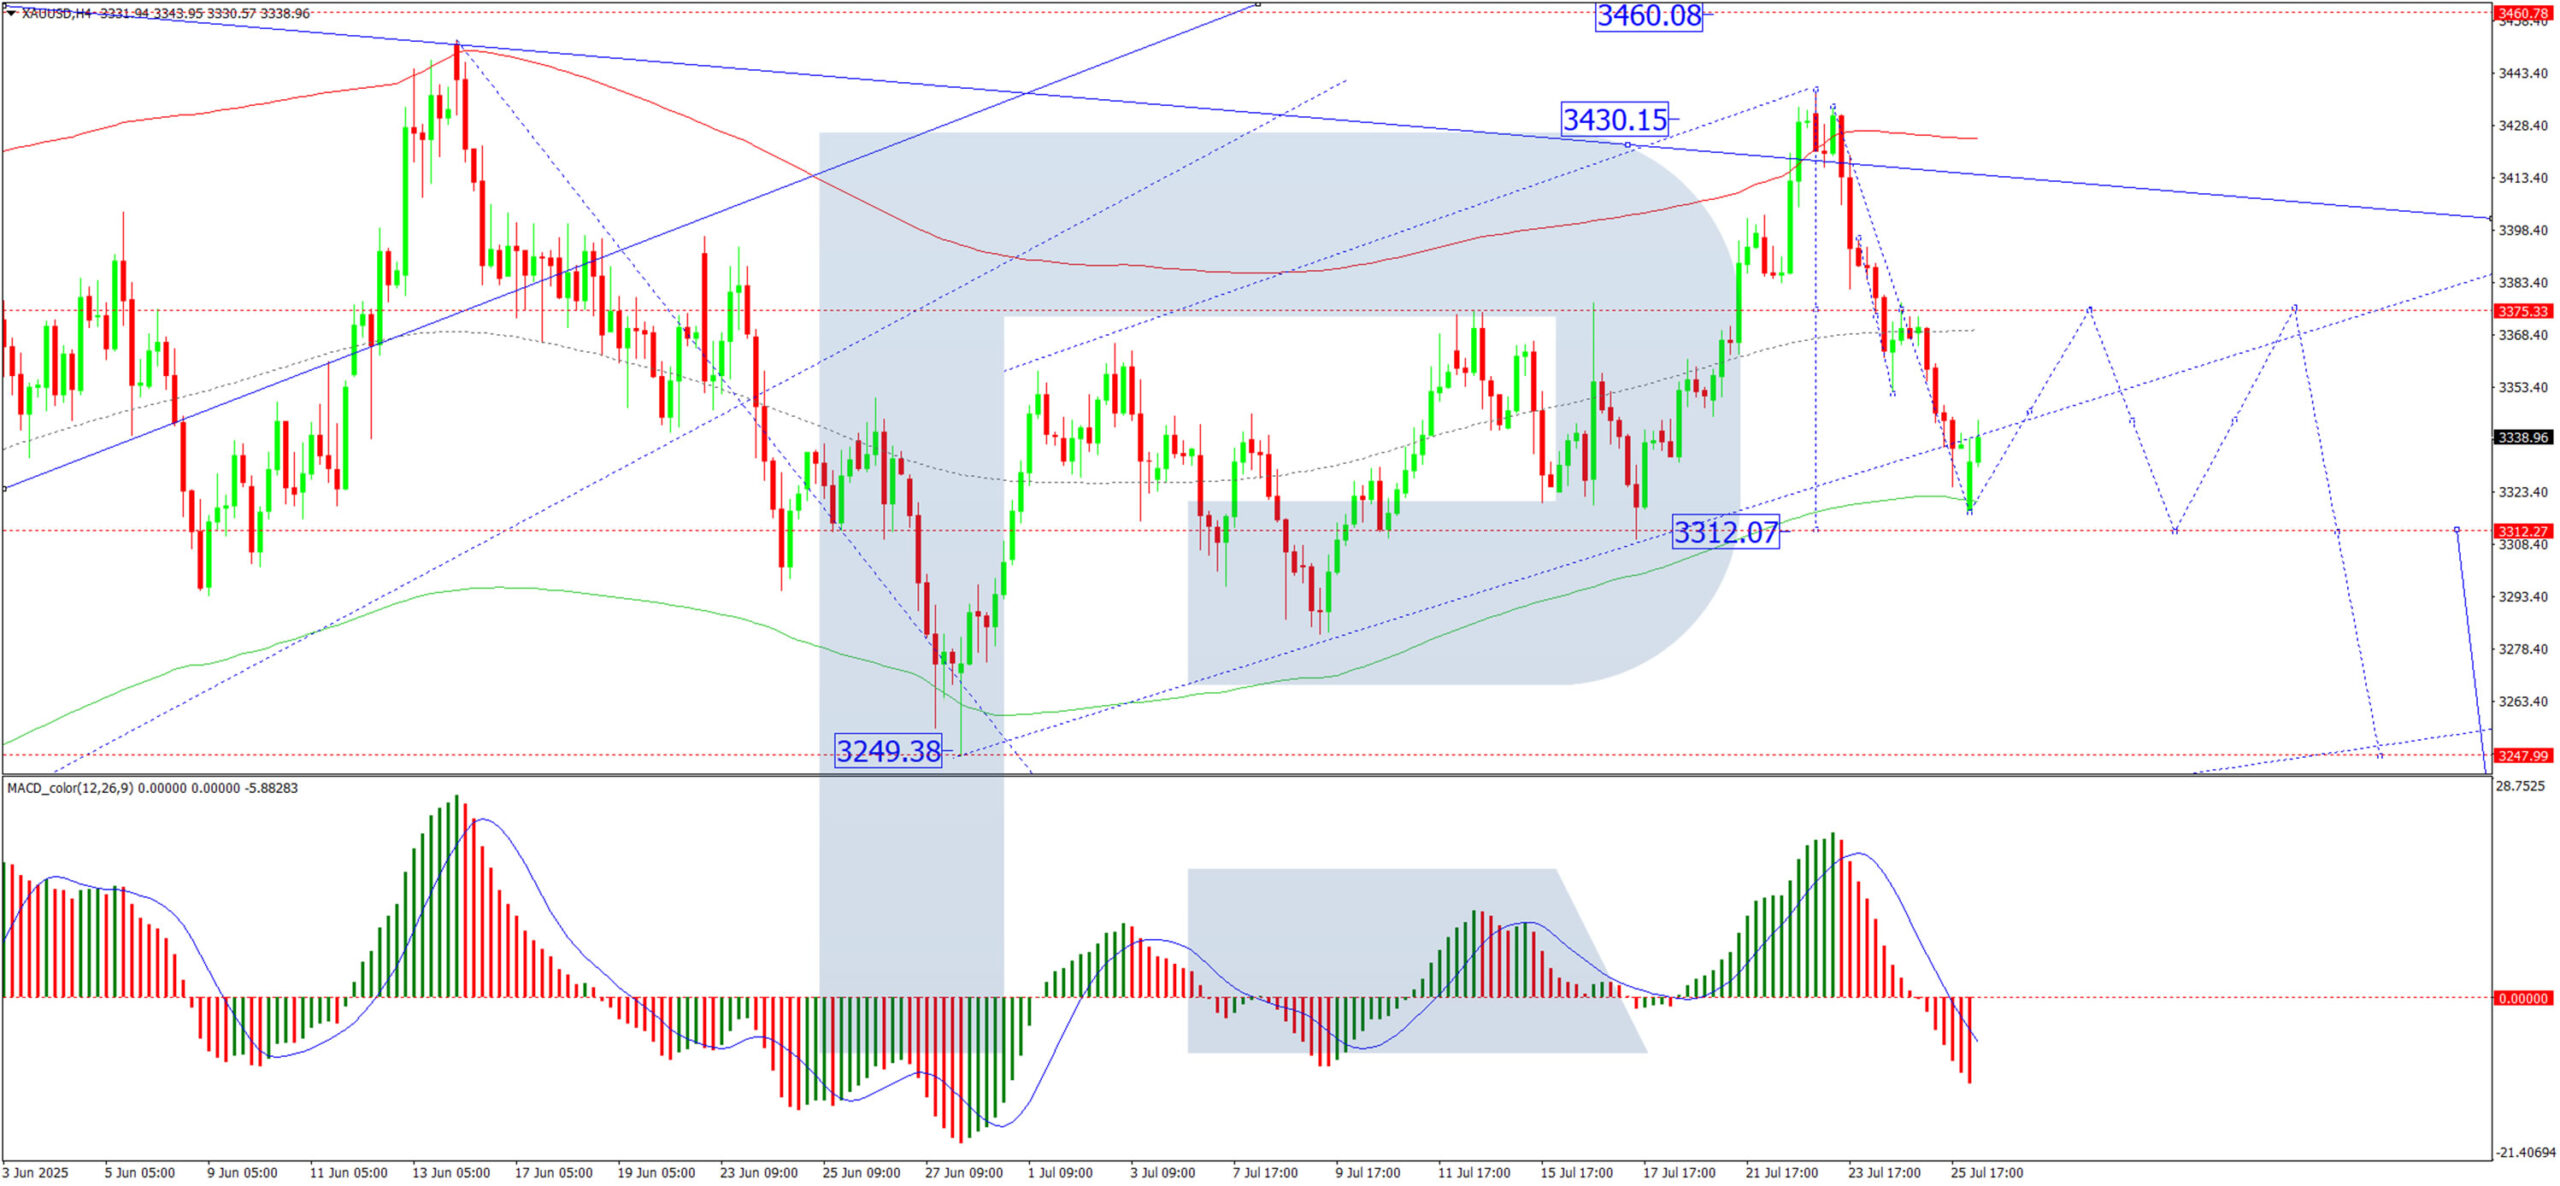
H4 Chart:

The H4 chart shows XAU/USD forming a broad consolidation range around 3,375. After breaking downward today, the market reached its local downside target at 3,318. Following this, we anticipate a possible upward correction towards 3,375 (testing from below), before a renewed decline towards 3,312. This scenario is supported by the MACD indicator, with its signal line below zero and pointing sharply downward.
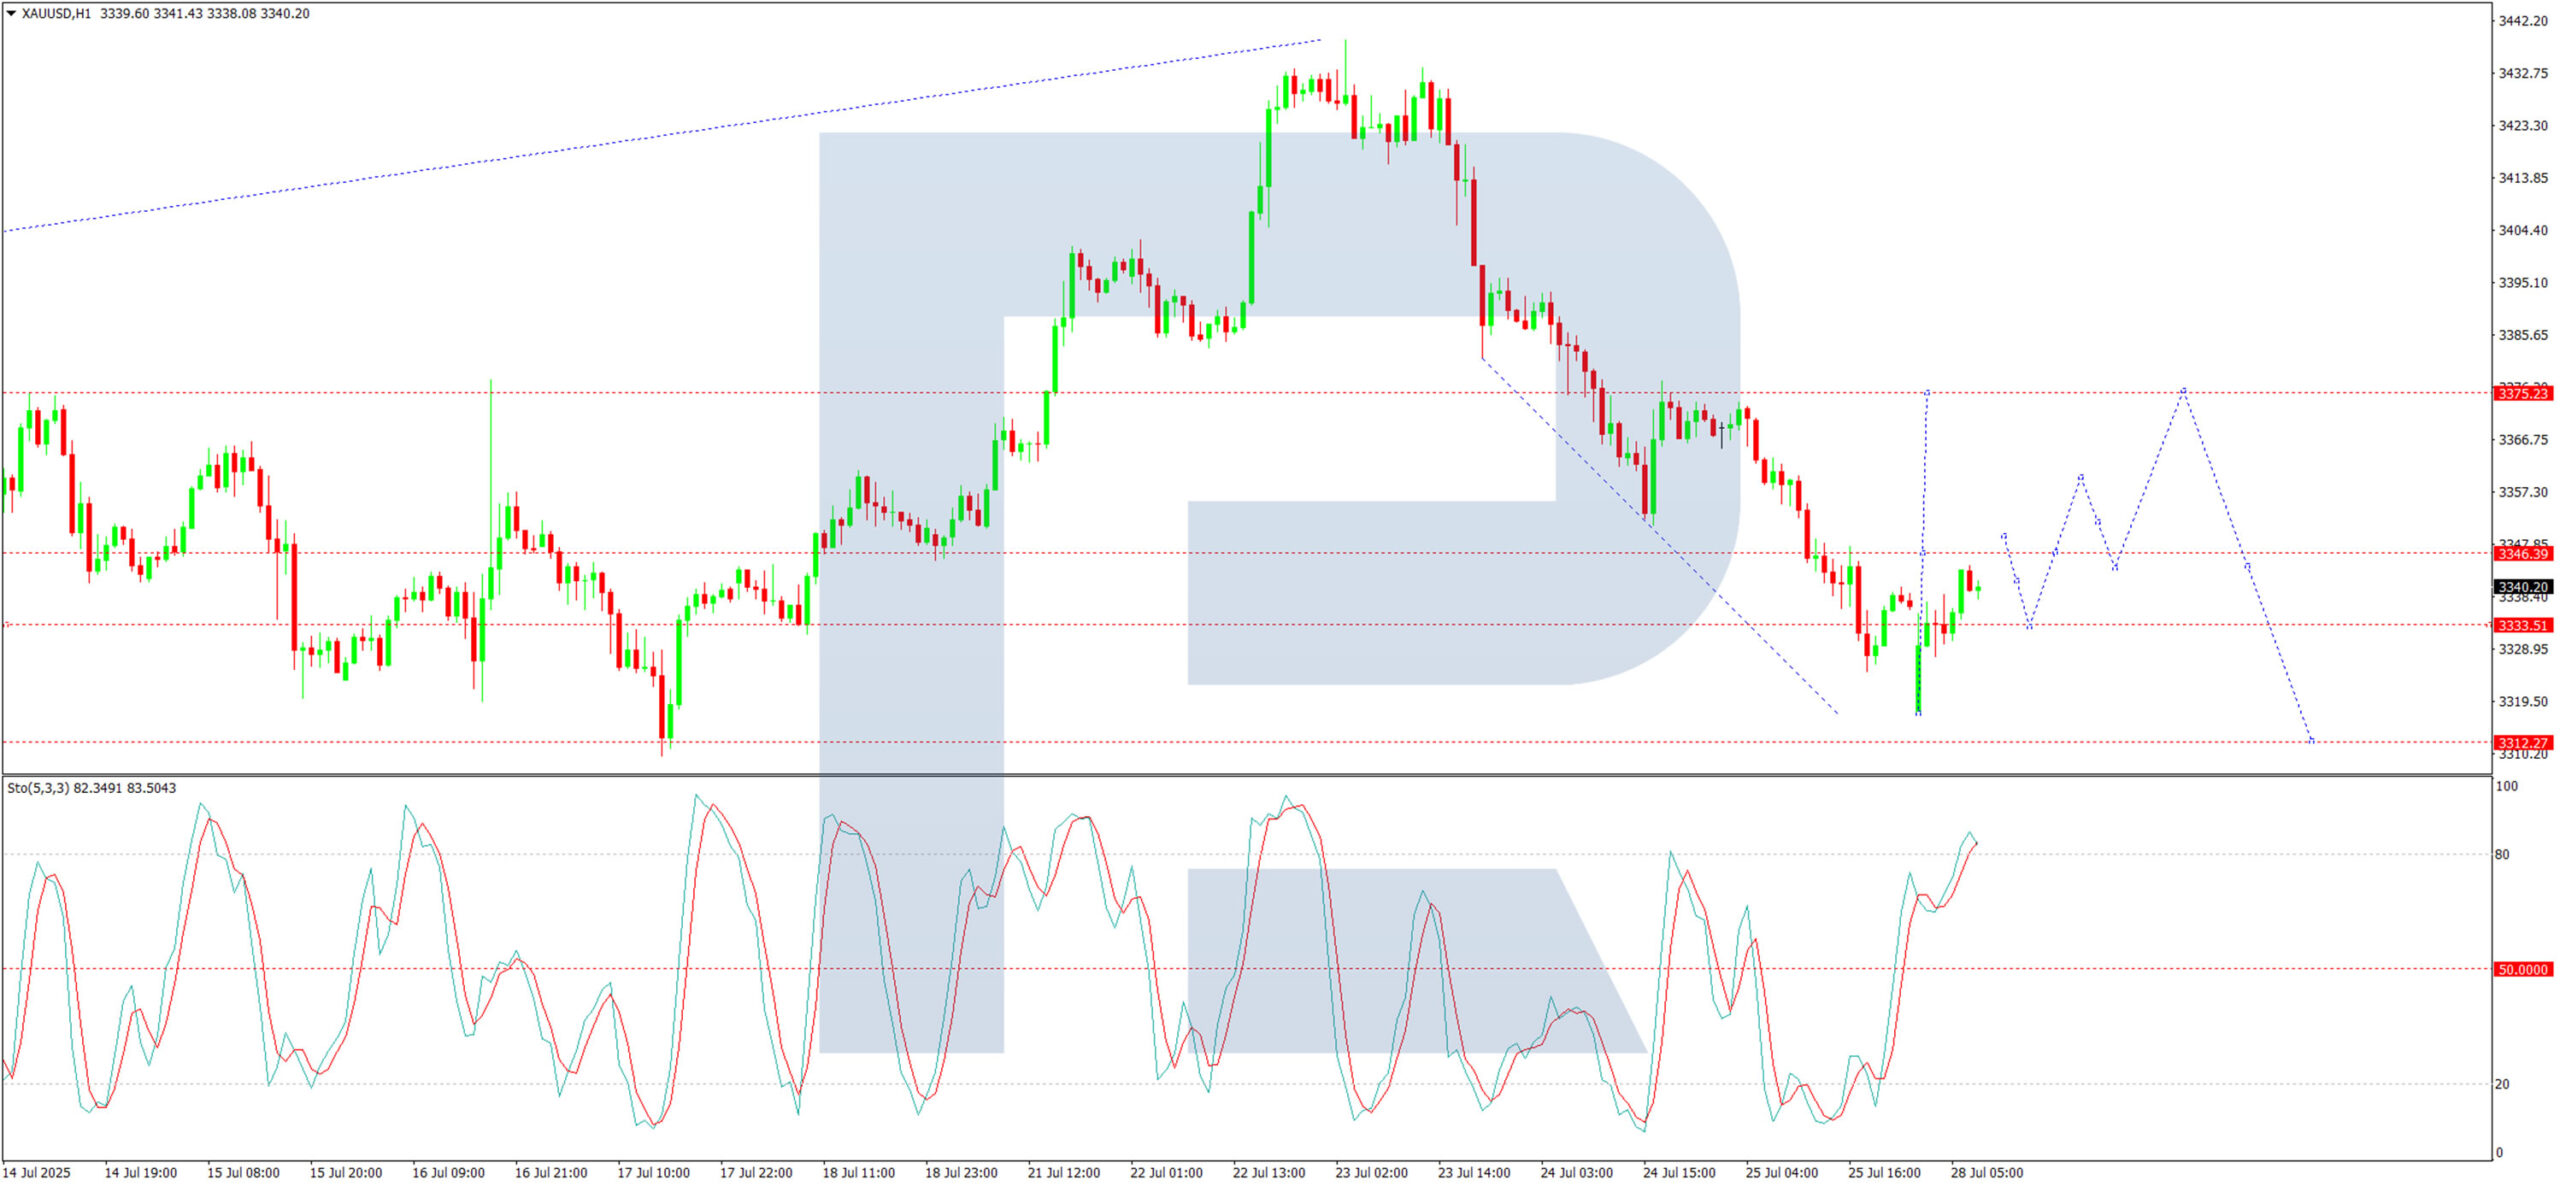
H1 Chart:

On the H1 chart, the market has achieved its local decline target at 3,318. Currently, an upward impulse is forming towards 3,349. A consolidation range near 3,346 may develop, with an upside breakout potentially extending gains to 3,375. Thereafter, a new downward wave towards 3,312 could emerge. The Stochastic oscillator aligns with this outlook, as its signal line is above 50 and rising sharply towards 80.

Conclusion

Gold remains under pressure amid shifting global trade dynamics, with technical indicators suggesting further volatility ahead. Traders should monitor key US data releases and signals from the Fed for directional cues.


Source link

Visited 1 times, 1 visit(s) today

Related Article

EUR/GBP Weekly Outlook - Action Forex

Markets Back Dollar Strength, Await Australian Inflation Clarity

Dollar’s broad-based advance continues today, underpinned by firm sentiment that recent US trade deals with the EU and Japan mark the clearing of major global trade risks, at least for now. Though US–China talks continue in Stockholm, markets appear unbothered. Officials on both sides have indicated willingness to negotiate terms and extend the August 12

EUR/GBP Weekly Outlook - Action Forex

EUR/USD Mid-Day Outlook – Action Forex

Daily Pivots: (S1) 1.1526; (P) 1.1648; (R1) 1.1711; More… Intraday bias in EUR/USD remains on the downside with focus on 55 D EMA (now at 1.1538). Sustained break there will argue that fall from 1.1829 is already correcting the whole rise from 1.0176. Deeper decline should then be seen to 38.2% retracement of 1.0176 to

UBS to Reportedly Fire Up to 36,000 Staff After Credit Suisse Takeover

Swiss Banking Giant UBS Retreats From FX After Trump Damage

UBS’s FX product retreat marks a decisive shift for the Swiss banking giant, and right now, following President Trump’s tariff announcements that actually triggered massive client losses in complex currency derivatives. The world’s second-largest wealth manager has ordered bankers to scale back sales of sophisticated forex instruments after clients suffered hundreds of millions in losses,

A person looking at a phone.

2 Brilliant Growth Stocks to Buy Now and Hold for the Long Term

Both of these stocks have significant long-term opportunities and an edge over their peers. The stock market took a sharp dip early this year, which can be scary for investors, not knowing how long a downturn might last. There have been bear markets that have gone on for years, and it’s not easy to stay

image

S&P 500 Analysis Today 29/07: Fresh Apex Height (Chart)

Yesterday started with a flourish for the S&P 500 as it jumped upwards upon opening and soon hit a high of nearly 6,429.00, this before selling off slightly and touching the 6,380.00 vicinity. The profit taking was then met by more buying and the S&P 500 was testing the 6,400.00 mark again. Monday’s buying surge