Gold Approached Upper Limit of the 4-Month Trading Range

Gold is trading above $3,400 again at the end of the week. The upper limit of the trading range, within which the price has been fluctuating since April, is close to $3,430. Jerome Powell’s signals about a rate cut, unprecedented pressure from the White House on the Fed, and the continuing high level of geopolitical risks have brought the price back to this level. Washington’s introduction of 50% tariffs against India risks further deepening the divide between the West and the East, as well as the associated processes of de-dollarisation and diversification of gold and foreign exchange reserves by central banks in favour of precious metals.

For the first time since 1996, central banks hold more gold (about 25%) than US government bonds (about 20%) in their gold and foreign exchange reserves. For comparison, between 2008 and 2015, this ratio fluctuated between 10% and 30%, respectively.

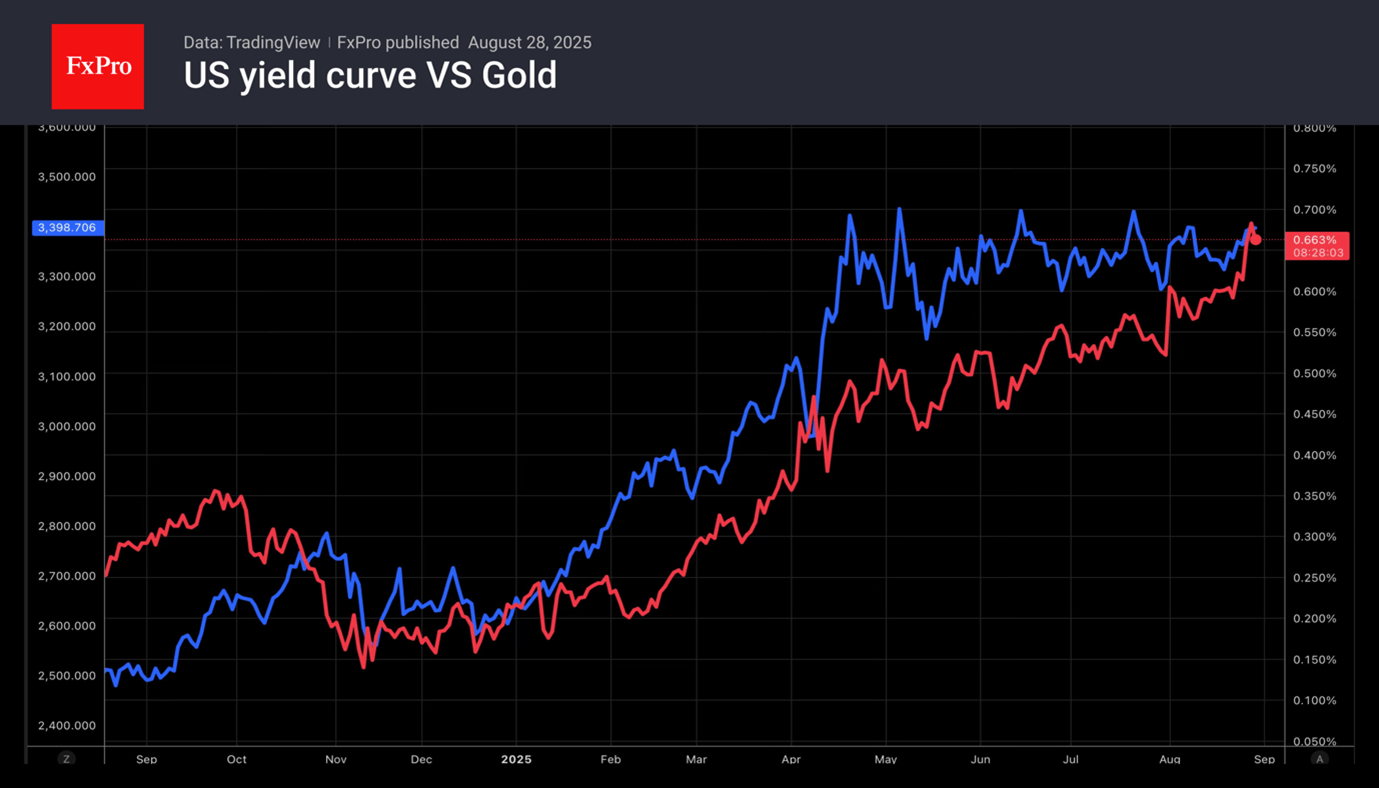
Gold bulls are drawing strength from the dynamics of the US yield curve. Yields on 2- and 10-year Treasuries are falling. The market is painting a stagflationary backdrop, which is the best food for gold bugs.

Gold’s ability to break through the resistance zone above $3,430 will be an important signal of the market’s readiness to return to a rally after four months of tug-of-war. But it is worth being cautious with early bullish bets at these levels. Formally, there is now a greater chance of another pullback to the lower end of the range at $3,300-3,315.

At the same time, investors should remember that whichever way the breakout occurs, the subsequent movement could be very strong, given how long the gold market has been gathering strength while remaining in a sideways trend.

Source link

Visited 1 times, 1 visit(s) today

Related Article

Clode: Oracle delivered a drop the mic number

Oracle stock booms 40%, on pace for best day since 1992

Oracle stock roared 40% higher on Wednesday after reporting gobsmacking cloud demand numbers, setting the company on track for a historic gain. The cloud giant is on pace for its best day since 1992, and is now quickly approaching the $1 trillion market cap benchmark. Oracle is now at $950 billion. The company said Tuesday

Line chart

Oracle Stock Price: Record-Shattering Rally by the Numbers

2025-09-10T17:01:46Z Share Facebook Email X LinkedIn Reddit Bluesky WhatsApp Copy link lighning bolt icon An icon in the shape of a lightning bolt. Impact Link Save Saved Read in app This story is available exclusively to Business Insider subscribers. Become an Insider and start reading now. Have an account? Log in. Oracle stock saw its

EUR/USD chart

Euro pauses ahead of ECB decision

The Euro (EUR) is holding steady against the US Dollar (USD), trading at 1.1710 on Wednesday. A wait-and-see attitude prevails ahead of the European Central Bank’s (ECB) monetary policy meeting, scheduled for Thursday at 12:15 GMT. Markets are widely expecting interest rates to remain unchanged. The deposit rate is expected to remain at 2.00%, while

President Lee Jae-myung (second from right) presides over his first cabinet meeting on June 5, 2025

Korea’s Kospi hits historic high, with rally seen extending

South Korea’s benchmark stock index closed at a record high on Wednesday, lifted by strong foreign and institutional demand for financial and blue-chip tech stocks on expectations for government market stimulus.   Analysts say the rally could extend through year-end, supported by Seoul’s push to upgrade its capital markets and prospects of US Federal Reserve

A human working alongside a humanoid robot.

10 Top AI Stocks to Buy Now

These 10 AI stocks offer exposure to every corner of the artificial intelligence revolution, from robotics to nuclear power. Artificial intelligence (AI) stocks continue dominating market headlines as companies race to capitalize on the $286 billion AI data center chip market projected by 2030. While megacaps like Nvidia (NVDA 4.50%) grab attention, savvy investors are

Meta Platforms Fundamental Analysis Snapshot

Is More Downside Ahead? (Chart)

Created on September 10, 2025 Short Trade Idea Enter your short position between $752.05 (the intra-day low of its last bearish candlestick) and $766.30 (yesterday’s intra-day high). Market Index Analysis Meta Platforms (META) is a member of the NASDAQ 100, the S&P 100, and the S&P 500 indices. All three indices are near all-time highs,

Strong Results Boosted The Trade Desk (TTD) in Q2

Brown Advisory, an investment management company, released its “Brown Advisory Large-Cap Growth Strategy” second-quarter 2025 investor letter. A copy of the letter can be downloaded here. The Brown Advisory Large-Cap Growth strategy has shown resilience this year amid heightened volatility, protecting investor capital during market declines and participating in the strong rebound since early April.