Gold Approached Upper Limit of the 4-Month Trading Range

Gold is trading above $3,400 again at the end of the week. The upper limit of the trading range, within which the price has been fluctuating since April, is close to $3,430. Jerome Powell’s signals about a rate cut, unprecedented pressure from the White House on the Fed, and the continuing high level of geopolitical risks have brought the price back to this level. Washington’s introduction of 50% tariffs against India risks further deepening the divide between the West and the East, as well as the associated processes of de-dollarisation and diversification of gold and foreign exchange reserves by central banks in favour of precious metals.

For the first time since 1996, central banks hold more gold (about 25%) than US government bonds (about 20%) in their gold and foreign exchange reserves. For comparison, between 2008 and 2015, this ratio fluctuated between 10% and 30%, respectively.

Gold bulls are drawing strength from the dynamics of the US yield curve. Yields on 2- and 10-year Treasuries are falling. The market is painting a stagflationary backdrop, which is the best food for gold bugs.

Gold’s ability to break through the resistance zone above $3,430 will be an important signal of the market’s readiness to return to a rally after four months of tug-of-war. But it is worth being cautious with early bullish bets at these levels. Formally, there is now a greater chance of another pullback to the lower end of the range at $3,300-3,315.

At the same time, investors should remember that whichever way the breakout occurs, the subsequent movement could be very strong, given how long the gold market has been gathering strength while remaining in a sideways trend.

Source link

Visited 1 times, 1 visit(s) today

Related Article

Opendoor stock soars 60% after company names new CEO

OpenDoor is disrupting the real estate market with its new model. It buys homes and sells them on its platform. Opendoor Opendoor stock rocketed 60% higher on Thursday after the retail favorite named Shopify executive Kaz Nejatian as CEO and co-founder Keith Rabois as chairman. The meme stock hit a 52-week high and continued a

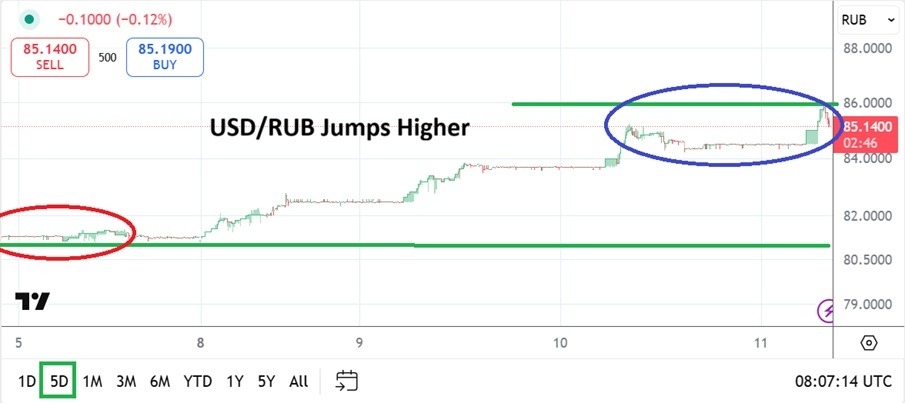
USD/RUB Analysis 11/09: Increase in Tensions (Chart)

USD/RUB Analysis 11/09: Increase in Tensions (Chart)

Created on September 11, 2025 The USD/RUB has gone from a rather tranquil value of 80.0000 in the past few days to above 85.0000 as of yesterday, this as it appears tensions are building and the prospects of increased conflict escalates. Since the first week of May this year the USD/RUB has seen trading within

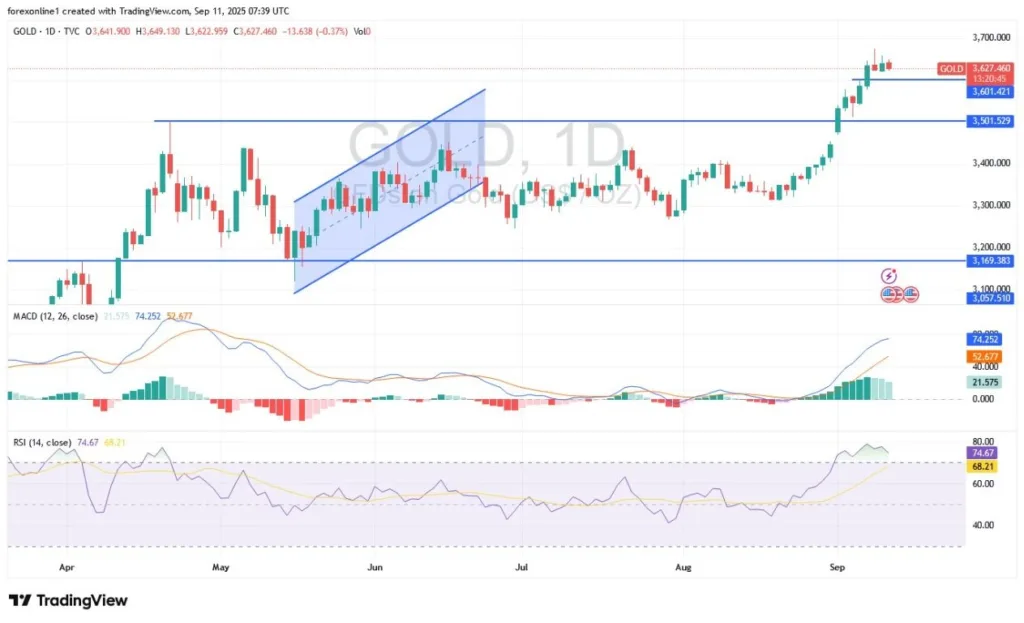
Gold Analysis 11/09: Gold Prices Stable (Chart)

Gold Analysis 11/09: Gold Prices Stable (Chart)

Created on September 11, 2025 Today’s Gold Analysis Overview: Overall Gold Trend: Strongly bullish. Support Levels: $3610 – $3570 – $3500 per ounce. Resistance Levels: $3670 – $3690 – $3730 per ounce. Today’s Gold Trading Signals: Sell: Sell gold from the $3685 resistance level, with a target of $3540 and a stop-loss at $3710. Buy:

Inflation climbs in August as grocery and gas prices jump : NPR

Grocery prices jumped 0.6% in August, fueling a sharper-than-expected jump in inflation last month. Frederic J. Brown/AFP hide caption toggle caption Frederic J. Brown/AFP Inflation inched higher last month as Americans closed out the summer paying more for both groceries and gasoline. Consumer prices in August were up 2.9% from a year ago, according to

Amazon.com Fundamental Analysis Snapshot

What Will Follow the Breakdown (Chart)

Created on September 11, 2025 Short Trade Idea Enter your short position between $229.10 (yesterday’s intra-day low) and $238.85 (the upper band of its horizontal resistance zone). Market Index Analysis Amazon.com (AMZN) is a member of the NASDAQ 100, the Dow Jones Industrial Average, the S&P 100, and the S&P 500 indices. All four indices

Why Is Opendoor (OPEN) Stock Soaring Today

This article first appeared on GuruFocus. Sep 11 – Opendoor (NASDAQ:OPEN) shares jump about 30% in early Thursday trading after the company names Kaz Nejatian as CEO and brings co-founder Keith Rabois back as chairman. The move follows last month’s resignation of Carrie Wheeler amid investor pressure and a period of intense retail interest that

Chanlink price chart | Source: Tradingview

Is a Breakout on the Horizon

Created on September 11, 2025 The Chainlink (LINK) token has steadily gained over the past week, and despite resistance capping its upside, buyers remain firmly in control of the broader trend. LINK Price Steady After Recent Gains Chanlink price chart | Source: Tradingview In the last 24 hours, LINK has traded between $23.18 and $23.87,

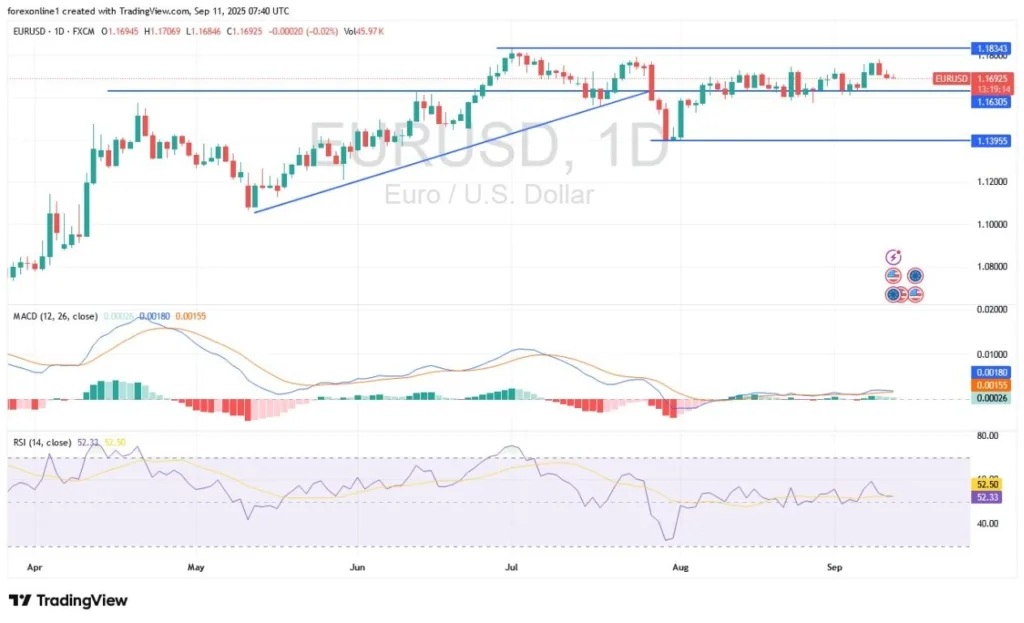
EUR/USD Analysis 11/09: Trading Awaits US Inflation (Chart)

Trading Awaits US Inflation (Chart)

Created on September 11, 2025 EUR/USD Analysis Summary Today Overall Trend: Cautiously neutral. Support Levels: 1.1660 – 1.1600 – 1.1540 Resistance Levels: 1.1750 – 1.1810 – 1.1880 EUR/USD Trading Signals: Buy: Buy EUR/USD from the support level of 1.1580, with a target of 1.1800 and a stop-loss at 1.1500. Sell: Sell EUR/USD from the resistance