Today’s Gold Analysis Overview:
- The overall Gold Trend: Bullish.
- Today’s Gold Support Levels: $3328 – $3280 – $3220 per ounce.
- Today’s Gold Resistance Levels: $3372 – $3390 – $3420 per ounce.
")
Today’s gold trading signals update:
- Sell Gold from the resistance level of $3393 with a target of $3300 and a stop-loss at $3420.
- Buy Gold from the support level of $3290 with a target of $3370 and a stop-loss at $3250.
Technical Analysis of Gold Price (XAU/USD) Today:
For three consecutive trading sessions, spot gold prices have benefited from the weakness of the US dollar, which has fallen to its lowest level in over three years. Consequently, gold bulls have successfully pushed the gold price index to the $3360 per ounce resistance level at the time of writing, recovering from last week’s losses which reached the $3246 per ounce support level. At that time, we recommended buying gold again through our free trading recommendations page. According to performance across gold trading platforms, the price increase will continue until financial markets react to the announcement of US jobs data later today, at 3:30 PM Egypt time, ahead of the US holiday tomorrow, Friday. As is known, US jobs figures and inflation rates shape market expectations for the future policies of the Federal Reserve.
Overall, the weakness of the US dollar has compensated the gold bullion market for the subdued investor sentiment towards buying gold as a safe haven amidst the de-escalation of tensions in the Middle East.
Trading Tips:
We still advise the strategy of buying gold on every price dip, but do not risk regardless of how strong the trading opportunities seem.
Recently, supporting the rise in gold futures, were statements by US President Trump that he would not extend the July 9 deadline for resuming higher tariffs on many countries targeted by the April Liberation Day. Trump also announced a trade agreement with Vietnam, allowing US goods to enter the country duty-free.
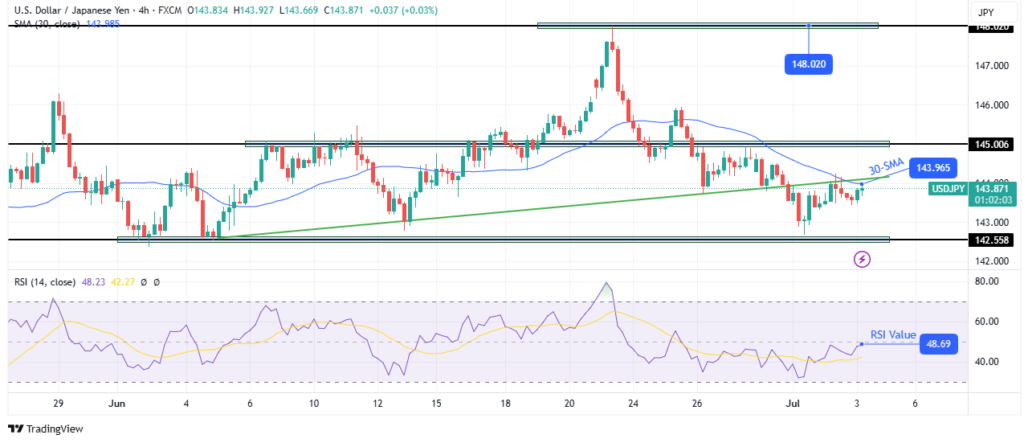
Regarding technical indicators, gold analysts’ forecasts confirm that the 14-day Relative Strength Index (RSI) is turning upwards, settling above the midline. At the same time, the MACD (Moving Average Convergence Divergence) lines are also changing direction, but still need further stimulus to enable bulls to move towards higher peaks. The $3400 per ounce psychological resistance will remain an easy target if global trade and geopolitical tensions increase, more central bank gold purchases are announced, and selling pressure on the US dollar continues, especially if US jobs figures come in lower than all expectations.
Will Gold Prices Reach the $4000 Per Ounce Peak?
Overall, the gold trading market is showing strong performance. A growing number of analysts believe that the gold price could reach the historic peak of $4000 per ounce. At present, there is no reason to doubt this. Gold prices had risen by 0.1% to reach $3360 yesterday, after rising five out of six days. This increase is partly due to developments in Washington. This week, the US Senate narrowly passed the tax bill, which President Donald Trump signed, and which could add over $3 trillion to the national debt. The President also stated on Tuesday that he would not extend the July 9 deadline for concluding trade agreements with dozens of countries.
Generally, these dynamics increase the likelihood that major foreign investors, especially central banks, will continue to prefer other US dollar-denominated assets such as Treasury bonds – a key factor in the rising gold price. Foreign central banks have historically relied on the US dollar as a source of hard currency reserves, but they have recently been concerned by the Trump administration’s political moves. Consequently, the People’s Bank of China increased its gold reserves for the seventh consecutive month in May, despite rising prices. Several other central banks, including US allies like Poland, have also been buying gold.
Therefore, the rise in gold price to $4000 per ounce is a matter of time, not probability. A number of Wall Street banks, including Goldman Sachs, Morgan Stanley, and Bank of America, are now forecasting that the gold price will reach this level in the coming months or years. Finally, other Wall Street firms have argued for months that the gold price could reach $4000 per ounce.
Ready to trade our Gold price forecast? We’ve made a list of the best Gold trading platforms worth trading with.