- The GBP/USD weekly forecast indicates trade optimism in the UK.
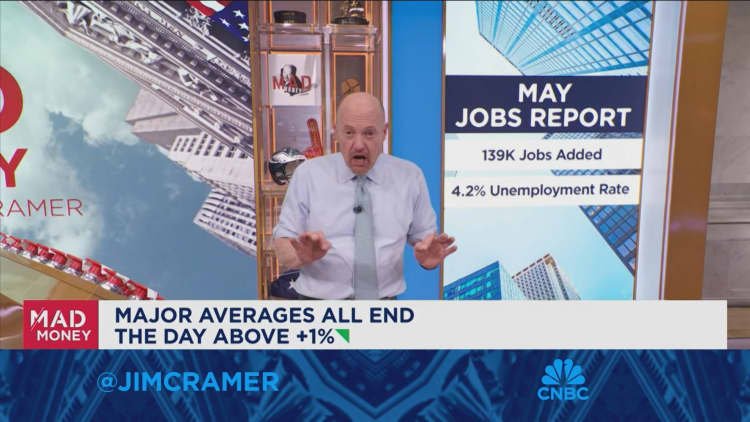
- A better-than-expected nonfarm payrolls report allowed the dollar to recover on Friday.
- Next week, the US will release crucial inflation figures.
The GBP/USD weekly forecast indicates trade optimism in the UK after exemptions from Trump’s steel and aluminum tariffs.
Ups and downs of GBP/USD
The GBP/USD pair had a bullish week as the pound gained on trade optimism and a weak dollar. However, the dollar recovered on Friday after upbeat employment figures.
–Are you interested to learn more about crypto signals? Check our detailed guide-
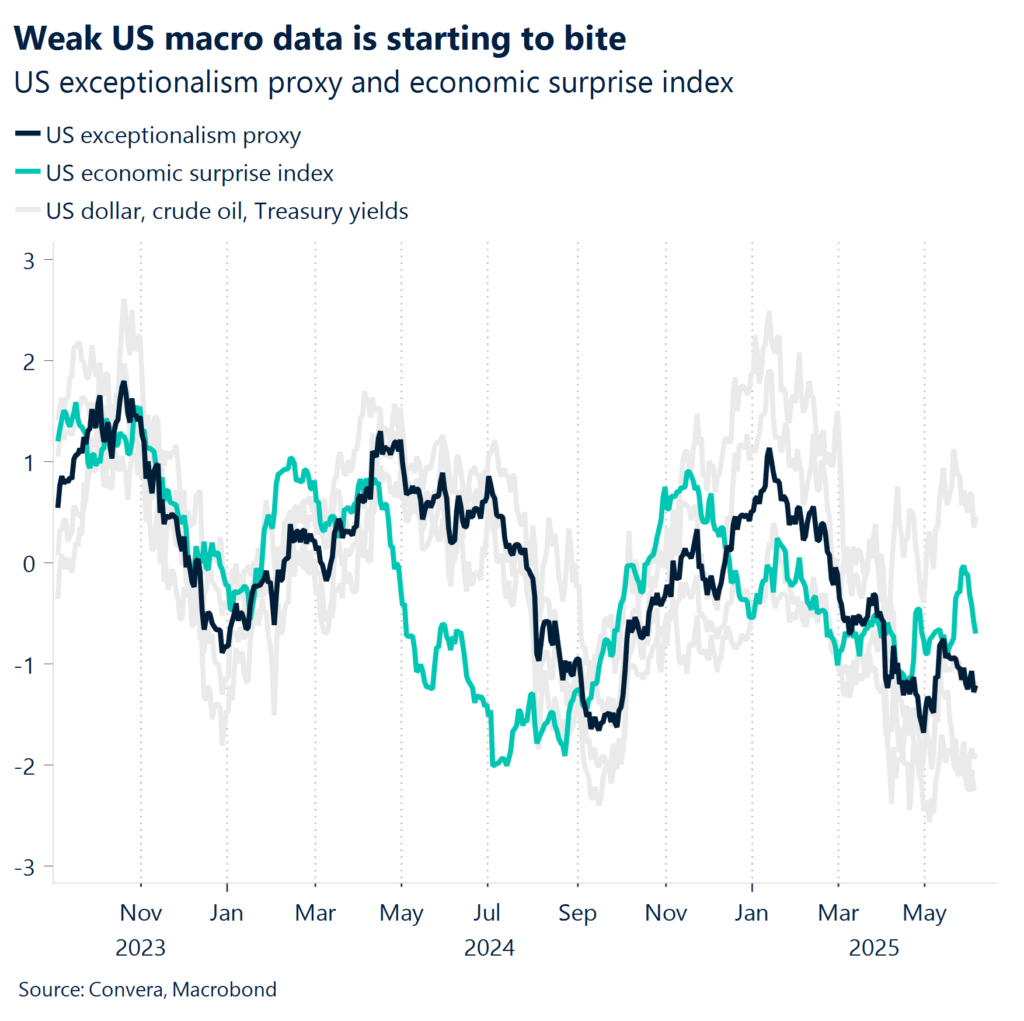
The UK has already signed a trade deal with the US. Therefore, when Trump doubled tariffs on steel and aluminum, Britain was exempted. At the same time, the dollar fell at the start of the week due to downbeat data on business activity and private employment. This allowed the pound to gain. However, a better-than-expected nonfarm payrolls report allowed the dollar to recover on Friday.
Next week’s key events for GBP/USD


Next week, market participants will focus on key economic reports from the UK, including employment, manufacturing production, and GDP. Meanwhile, the US will release consumer and wholesale inflation figures.
UK employment and GDP numbers will show the state of the economy, shaping the outlook for BoE policy. At the moment, market participants expect the central bank to pause at its next meeting. Still, the outlook for future moves will continue to change with incoming data.
Meanwhile, US inflation numbers will show whether Trump’s tariffs have increased price pressures. If not, policymakers will be confident to cut rates in September.
GBP/USD weekly technical forecast: Bearish RSI divergence


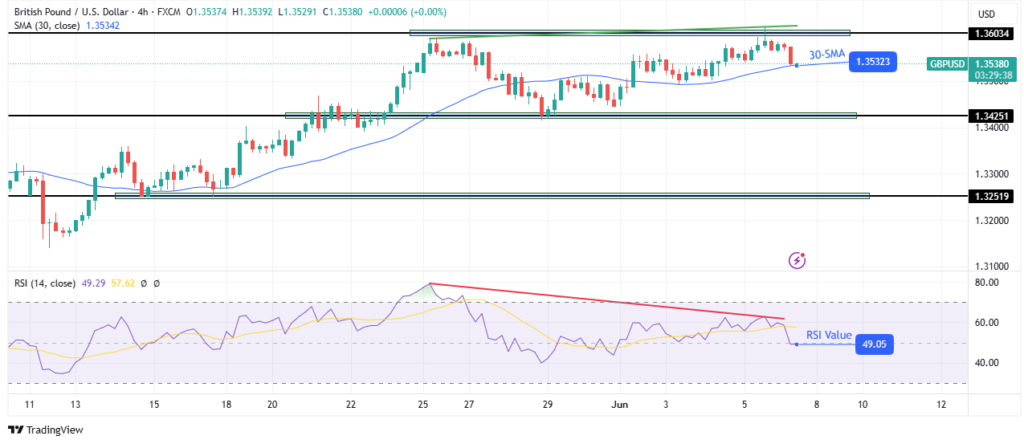
On the technical side, the GBP/USD price has made new peaks near the 1.3603 key level. Moreover, it trades above the 30-SMA, with the RSI above 50, indicating a solid bullish bias. However, while the price has reached a new high in the uptrend, the RSI has made a lower high, indicating a bearish divergence.
–Are you interested to learn more about forex robots? Check our detailed guide-
This is a sign that bullish momentum is fading. Therefore, bears might get stronger and push the price below the 22-SMA. Such a move would allow GBP/USD to retest the 1.3201 support level. However, bulls will remain in the lead as long as the price stays above the support trendline.
On the other hand, if bulls regain momentum, the price will likely retest the 1.3603 resistance level. A break above would strengthen the bullish bias by making a higher high.
Looking to trade forex now? Invest at eToro!
67% of retail investor accounts lose money when trading CFDs with this provider. You should consider whether you can afford to take the high risk of losing your money.


