GBP/USD Forex Signal Today 18/08: More Gains (Chart)

Bullish View

  • Buy the GBP/USD pair and set a take-profit at 1.3785.
  • Add a stop-loss at 1.3450.
  • Timeline: 1-2 days.

Bearish View

  • Sell the GBP/USD pair and set a take-profit at 1.3450.
  • Add a stop-loss at 1.3785.

GBP/USD Forex Signal Today 18/08: More Gains (Chart)

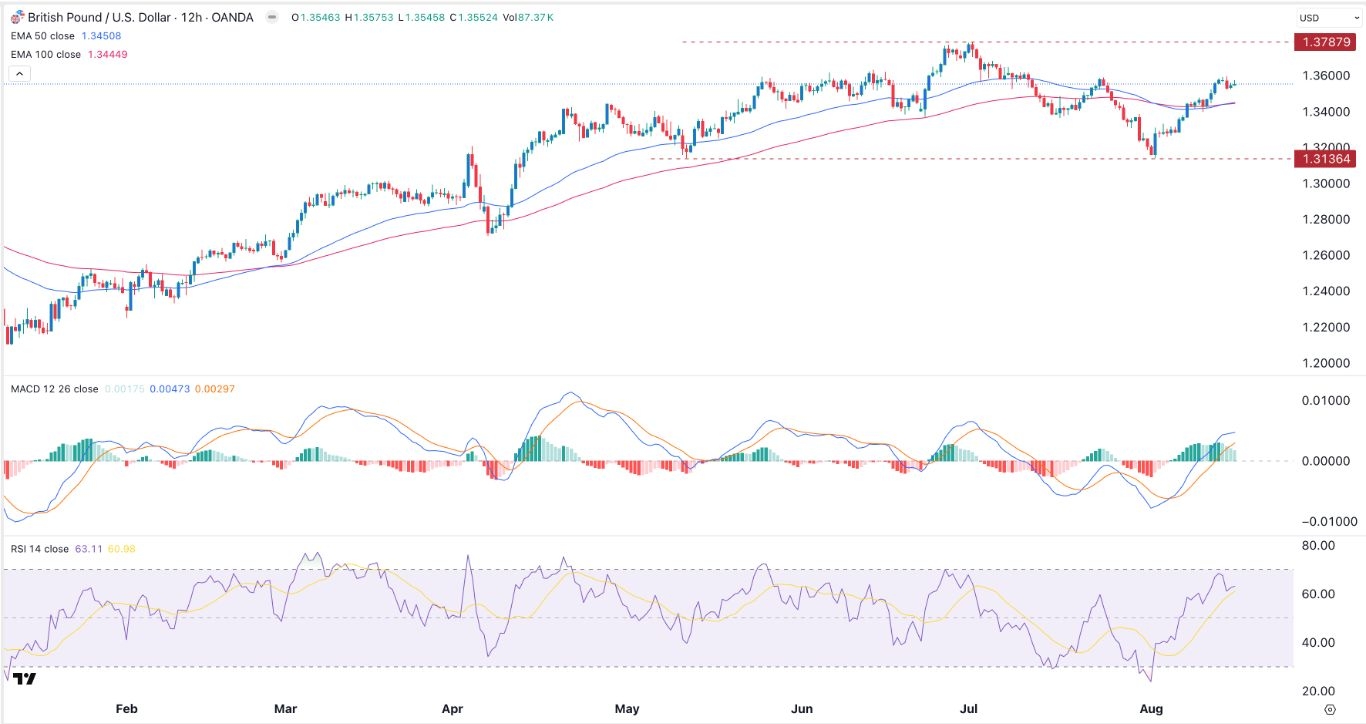
The GBP/USD exchange rate continued its recent rally after the US economic data pointed to stagflation and the UK released a surprisingly strong GDP data. It was trading at 1.3552 on Monday, up sharply from this month’s low of 1.3136.

UK Inflation Data Ahead

The GBP/USD exchange rate continued rising after the UK published its jobs and GDP data. A report by the Office of National Statistics (ONS) showed that hiring slowed, even as wage growth continued. UK payrolls dropped for six consecutive months, while vacancies continued their downtrend.

At the same time, wage growth continued, leading to concens that inflation will be stickier for longer than expected. Another report showed that the UK economy grew at a faster pace than expected. It grew by 0.3% in Q2, better than the median estimate of 0.2%, and lower than the 0.7% growth in Q1.

The next key data to watch will be the upcoming UK consumer inflation data on Wednesday. Economists expect the data to show that the headline consumer inflation rose from 3.6% in June to 3.7% in July, while the core figure rose to 3.8%.

These numbers will confirm the view that the economy was in a stagflation period, which is characterized by high inflation and high unemployment rate. Stagflation will make it difficult for the Bank of England (BoE) to deliver its interest rate decision.

The GBP/USD exchange rate rose after US published strong consumer inflation data. The report showed that the headline consumer price index (CPI) remained at 2.7%, while the core CPI moved from 2.8% in June to 3.1%.

GBP/USD Technical Analysis

The 12-hour chart shows that the GBP/USD exchange rate bottomed at 1.3135, forming a double-bottom pattern. It has now crossed the 50-period and 100-period moving averages, which have now formed a bullish crossover.

The MACD indicator has moved above the zero line, while the Relative Strength Index (RSI) has rallied above 50. Therefore, the pair will likely continue rising as bulls target the key resistance at 1.3787, its highest point on July 1.

A move above that level will point to more gains, with the next key level to watch being at 1.3800. A move below the 50-period moving average at 1.3450 will invalidate the bullish forecast.

Ready to trade our free trading signals? We’ve made a list of the best UK forex brokers worth using.

Crispus Nyaga is a financial analyst, coach, and trader with more than 8 years in the industry. He has worked for leading companies like ATFX, easyMarkets, and OctaFx. Further, he has published widely in platforms like SeekingAlpha, Investing Cube, Capital.com, and Invezz. In his free time, he likes watching golf and spending time with his wife and child.

Source link

Visited 1 times, 1 visit(s) today

Related Article

Avexbot Sets a Clear Data Standard for GBP/USD Automation

Avexbot Sets a Clear Data Standard for GBP/USD Automation

By DailyForex Press Release Created on August 20, 2025 MT4 Expert Advisor with candlestick-based analysis and rule-driven execution on M15; demo available for evaluation. Limassol, Cyprus – August 2025 – Traders don’t just need more signals; they need cleaner ones that hold up when conditions shift. Avexbot, an MT4 Expert Advisor focused on GBP/USD, pairs

USD/CAD Forex Signal 20/08: Eyes Breakout (graph)

USD/CAD Forex Signal 20/08: Eyes Breakout (Video)

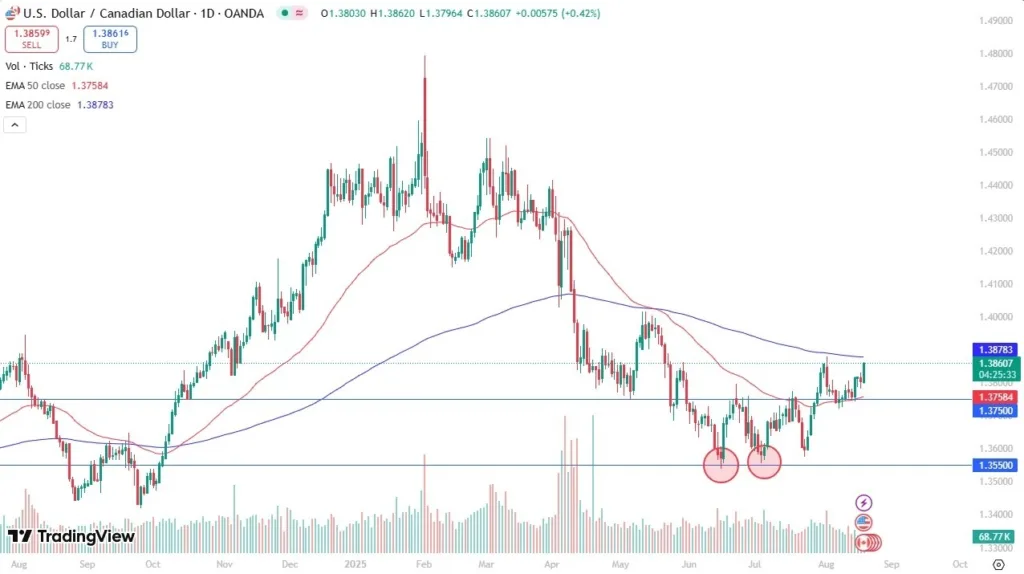
Created on August 20, 2025 Potential signal: I am a buyer of the USD/CAD pair on a break over the 200 Day EMA, with a stop loss of 100 points. I have a target of 1.3980 above. The US dollar has risen quite nicely against the Canadian dollar during the trading session on Tuesday to

EUR/USD Forecast Today 20/08: Attempts Recovery (Chart)

EUR/USD Forecast Today 20/08: Attempts Recovery (Chart)

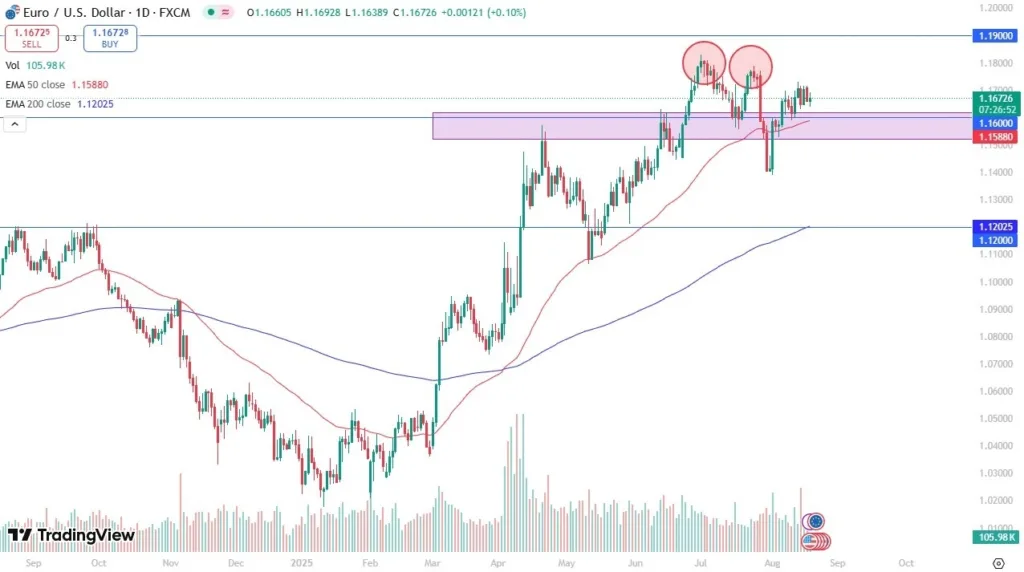
Created on August 20, 2025 The euro has been slightly positive during the early hours here on Tuesday, as we continue to see a lot of noisy behavior coming out of the Forex markets, especially as traders are trying to get an idea as to where monetary policy is going to be with the Americans.

GBP/USD Forex Signal 20/08: Double Top Pattern Forms (Chart)

Double Top Pattern Forms (Chart)

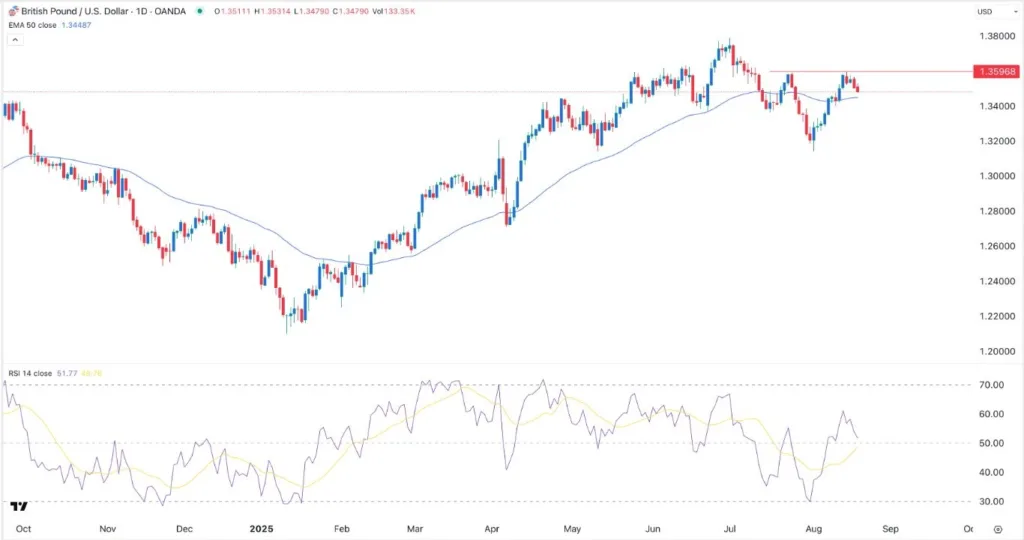
Created on August 20, 2025 Bearish view Sell the GBP/USD pair and set a take-profit at 1.3350. Add a stop-loss at 1.3595. Timeline: 1-2 days. Bullish view Buy the GBP/USD pair and set a take-profit at 1.3595. Add a stop-loss at 1.3350. The GBP/USD exchange rate pulled back for two consecutive days as traders focused

17556733817578

Pound Sterling finds support on hot inflation, eyes on FOMC Minutes

Here is what you need to know on Wednesday, August 20: Pound Sterling holds its ground following a two-day slide as markets assess July inflation data from the UK. Later in the American session, the Federal Reserve (Fed) will release the minutes of the July 29-30 policy meeting. Several Fed policymakers are scheduled to deliver

ET logo

Rupee falls 3 paise to 87.16 against US dollar in early trade

The rupee was trading in a tight range and depreciated 3 paise to 87.16 against the US dollar in early trade on Wednesday, tracking weak Asian peers and a negative trend in domestic equities. Forex traders said investors are taking a cautious approach as the market eyes potential Russia-Ukraine talks. Moreover, traders are awaiting cues

SoftBank and Trump may not be enough to save Intel

Intel (INTC) rose roughly 7% on Tuesday, a day after SoftBank Group announced it would take a $2 billion stake in the struggling chipmaker. News of SoftBank’s investment follows a Bloomberg report last week that said the Trump administration is considering taking up to a 10% position in the company. Treasury Secretary Scott Bessent confirmed

Stock Market Today: Nvidia Slides Despite Bullish Analyst Revisions

Stock Market Today: Nvidia Slides Despite Bullish Analyst Revisions

Nvidia(NASDAQ: NVDA) shares fell 3.5% on Tuesday, closing at $175.64, as tech stocks broadly pulled back following a recent rally. The chipmaker traded 183 million shares, just above its three-month average of 181 million, signaling a cooling of momentum after reaching record highs earlier this month. The broader markets reflected similar unease. The Nasdaq Composite