GBP/USD Forex Signal 22/10: Sterling Pressured (Chart)

Bearish view

  • Sell the GBP/USD pair and set a take-profit at 1.3250.
  • Add a stop-loss at 1.3450.
  • Timeline: 1-2 days.

Bullish view

  • Buy the GBP/USD pair and set a take-profit at 1.3450.
  • Add a stop-loss at 1.3250.

GBP/USD Forex Signal 22/10: Sterling Pressured (Chart)

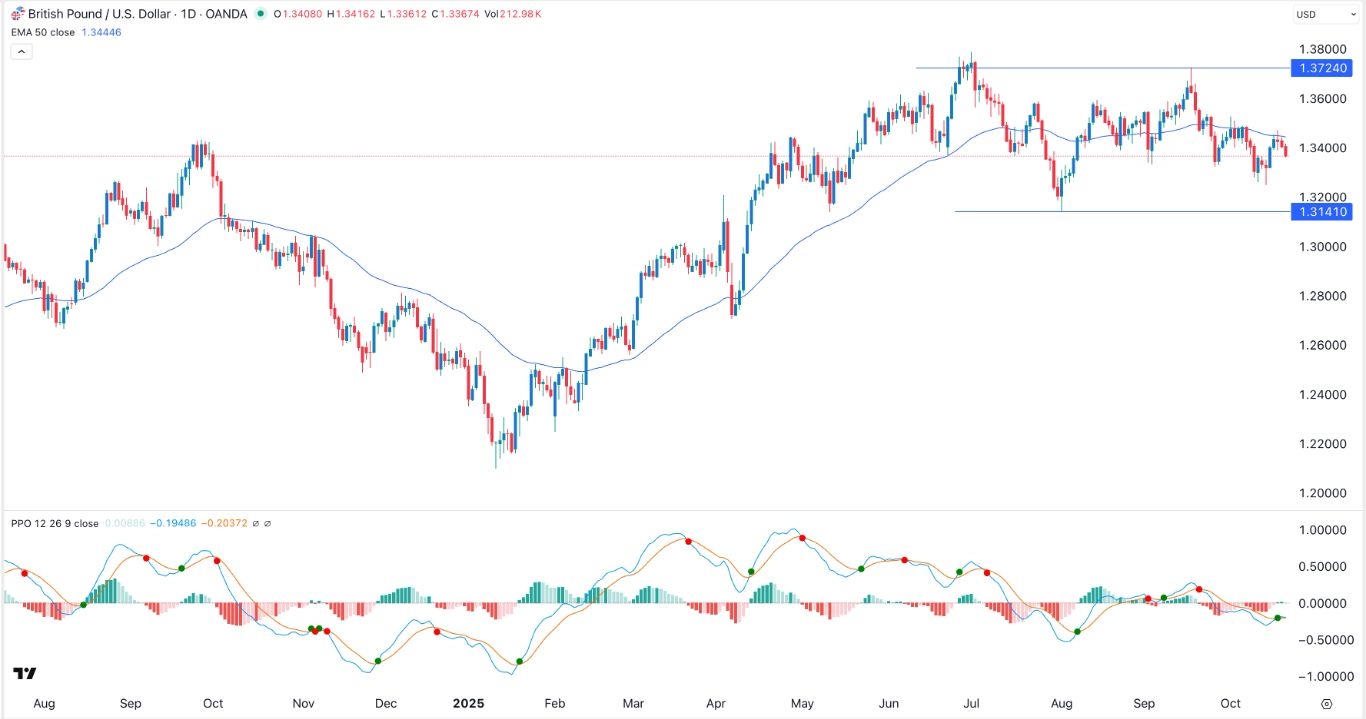
The GBP/USD exchange rate retreated slightly ahead of the upcoming UK inflation data. It moved below the important support level at 1.3400, down from the year-to-date high of 1.3795.

UK Inflation Data Ahead

The GBP/USD pair dropped slightly ahead of the closely-watched UK inflation numbers, which will provide more color on the state of the economy and what to expect from the Bank of England (BoE).

Economists expect the data to confirm that inflation continued rising in September. The headline Consumer Price Index (CPI) is expected to come in at 3.8%, up from the previous 4%. Core inflation is expected to move from 3.6% in August to 3.7% in September.

If these estimates are accurate, it means that consumer prices are moving further away from the Bank of England’s target of 2.0%. It will also confirm further that the UK is in a stagflation period characterized by rising inflation and slow economic growth.

The next important UK news will come out on Friday when the country publishes the latest retail sales numbers. Economists expect the data to show that the country’s retail sales slowed from 0.5% in August to minus 0.2% in September.

These numbers will help the Bank of England when making its interest rate decision next month. Analysts expect the bank to leave rates unchanged as cutting may worsen the inflation situation.

The GBP/USD pair also reacted to the relatively stronger US dollar. Data shows that the US dollar index rose to $99.96, up from the year-to-date low of 96.41. It has risen as traders wait for talks between the US and China. In a statement on Tuesday, Donald Trump said he expected a good meeting with Xi, but tempered expectations, warning that it might not happen.

GBP/USD Technical Analysis

The daily timeframe chart shows that the GBP/USD exchange rate has come under pressure in the past few days. It remained below the 50-day Exponential Moving Average (EMA), while the Percentage Price Oscillator (PPO) has moved below the zero line.

The pair has formed a double-top-like pattern whose neckline was at 1.3141, its lowest level in July. Therefore, the most likely scenario is where it continues falling, with the next key support level to watch being at 1.3250. A move above the resistance at 1.3450 will invalidate the bearish outlook.

Ready to trade our free daily Forex trading signals? We’ve shortlisted the best UK forex brokers in the industry for you.

Crispus Nyaga is a financial analyst, coach, and trader with more than 8 years in the industry. He has worked for leading companies like ATFX, easyMarkets, and OctaFx. Further, he has published widely in platforms like SeekingAlpha, Investing Cube, Capital.com, and Invezz. In his free time, he likes watching golf and spending time with his wife and child.

Source link

Visited 1 times, 1 visit(s) today

Related Article

Stocks rise on China-US hopes, gold and silver slump

Gold suffered its biggest one-day loss since the start of the Covid pandemic, only a day after setting a record high (DAVID GRAY) Most stock markets extended gains Tuesday on further signs that China-US trade tensions were easing and as investors looked to corporate earnings. Tokyo hit another record as Japan swore in new prime

EUR/USD Analysis Today 21/10: Price Correction (Chart)

EUR/USD Analysis Today 21/10: Price Correction (Chart)

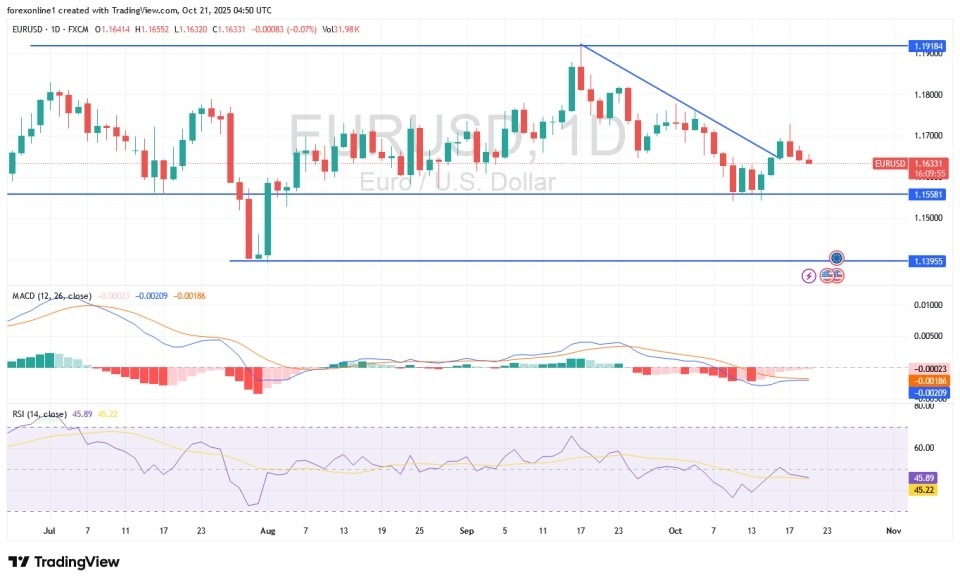
Created on October 21, 2025 EUR/USD Analysis Summary Today Overall Trend: Weak upward correction. Support Levels for EUR/USD Today: 1.1600 – 1.1550 – 1.1480. Resistance Levels for EUR/USD Today: 1.1700 – 1.1780 – 1.1850. EUR/USD Trading Signals: Buy the EUR/USD from the support level of 1.1560, target 1.1800, and stop 1.1480. Sell the EUR/USD from

Best Currency Pairs to Trade for Beginners

Best Currency Pairs to Trade for Beginners in 2025

For beginners in 2025, sticking with the major pairs, particularly EUR/USD, USD/JPY, GBP/USD, AUD/USD, USD/CAD and EUR/GBP, is the best call as they offer the tightest spreads, deepest liquidity, simpler macro drivers and lots of educational resources. Additionally, trade during major session overlaps (London–New York, Tokyo–London), size positions conservatively, use stop losses, and focus on

Gold Analysis 21/10: Trades Near its All-Time High (Chart)

Trades Near its All-Time High (Chart)

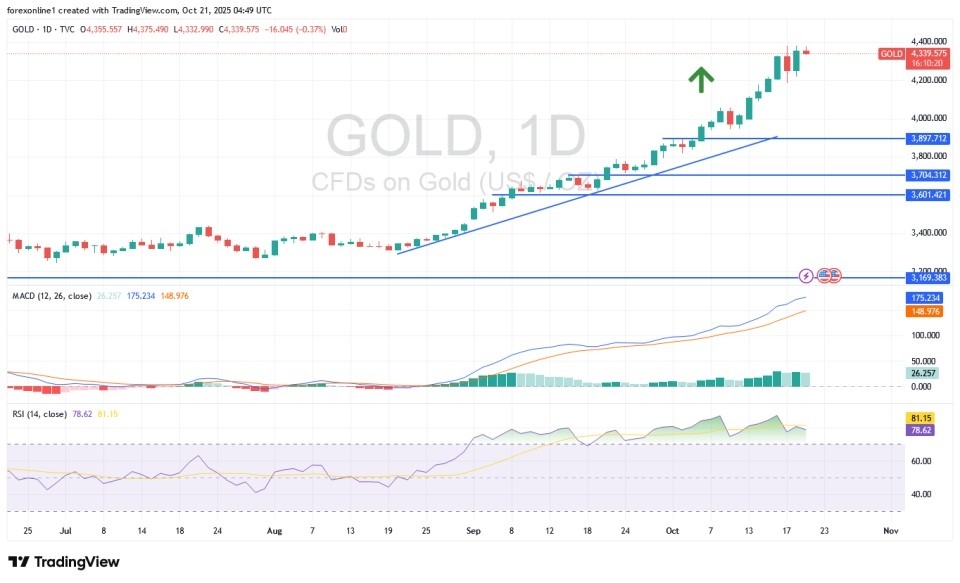
Created on October 21, 2025 Today’s Gold Analysis Overview: The overall of Gold Trend: Strongly bullish. Today’s Gold Support Points: $4290 – $4200 – $4170 per ounce. Today’s Gold Resistance Points: $4385 – $4440 – $4500 per ounce. Today’s Gold Trading Signals: Sell Gold from the resistance level of $4400, with a target of $4200

Gold Technical Forecast

Gold Outlook: Modest Losses from Record Highs as Greenback Strengthens

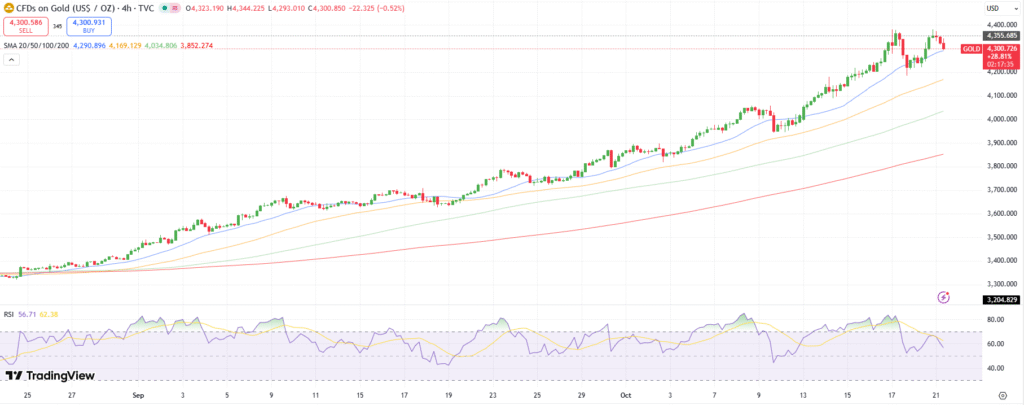
The ongoing geopolitical tensions, like the US-China trade tensions and the war between Russia and Ukraine, lend support to gold. The pullback seems short-term amid a stronger US dollar as expectations of Fed easing continue to enhance gold’s safe-haven appeal.  Traders look forward to FOMC’s Waller speech for further policy cues. The gold outlook indicates

A Beyond Burger with a Beyond Meat flag in it.

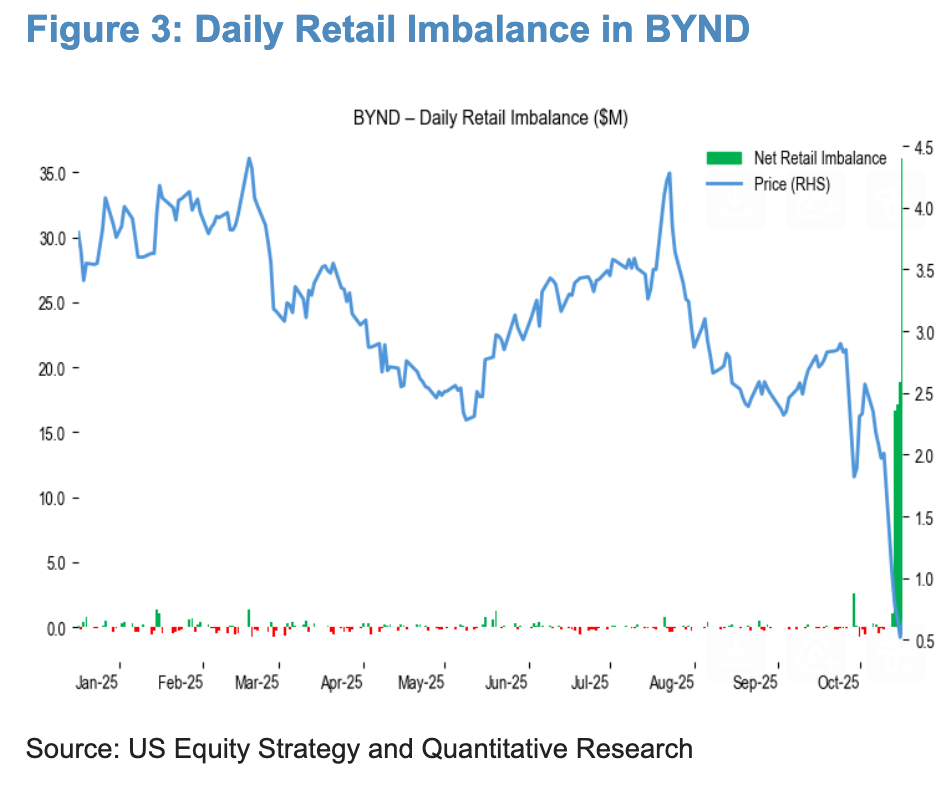
Up Over 100% in 24 Hours, Is Beyond Meat Stock the Next AMC?

Beyond Meat skyrocketed on a short squeeze. Here’s what you need to know. The meme stock marauders were back with a vengeance today, with a surge not seen since the days of GameStop and AMC Entertainment during the peak of the COVID-19 pandemic. This time, it was Beyond Meat (BYND 127.70%) ripping higher on a

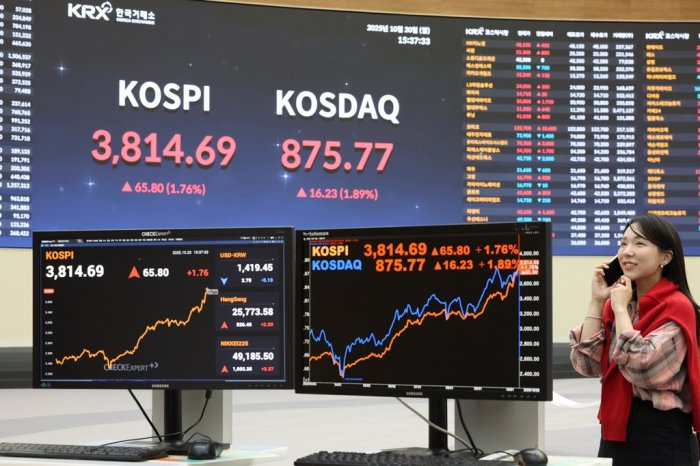
South Korea’s benchmark Kospi index surged past 3,800 points on Monday

S.Korea’s Kospi now world’s top-performing index as chip rally powers record highs

South Korea’s benchmark Kospi index has surged past 3,800 points, cementing its position as the world’s best-performing major stock market this year amid an investor frenzy over semiconductor stocks. On Monday, the index closed at a record 3,814.69, up 1.76% from last Friday. Seoul shares continued to rise in early Tuesday trade, with the index