GBP/USD Forecast 15/09: Threatens Resistance (Chart)

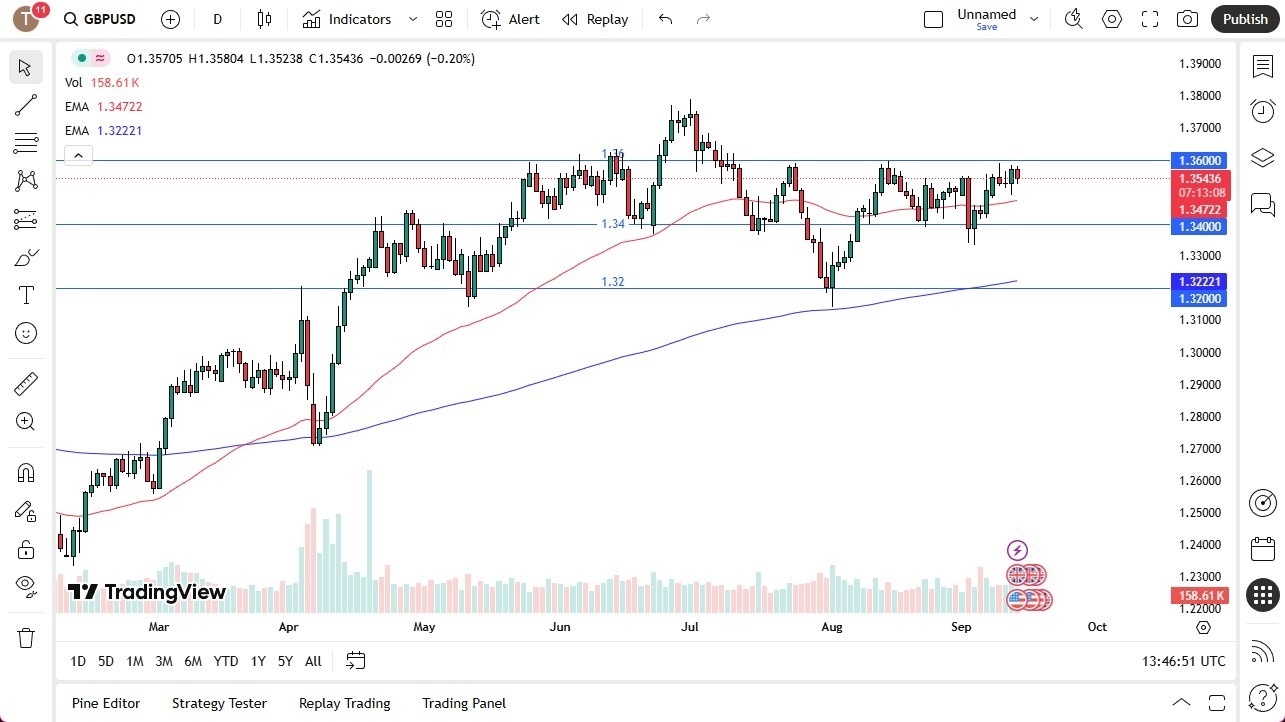
  • The British pound has pulled back just a bit in the early hours here on Friday, but it still looks as if the buyers are willing to come in and pick up each dip, to perhaps eventually send the British pound above the crucial 1.36 level above.
  • That is a major resistance barrier that I think will continue to be watched very closely, and if we can break above that level, it could open up a rush of new buying.
  • However, we have seen a lot of selling pressure at that area, and it does make a certain amount of sense that traders will need some type of new information to make a breakout happen.

GBP/USD Forecast 15/09: Threatens Resistance (Chart)

Technical Analysis

The technical analysis for this market is relatively flat at the moment, but the longer term charts certainly look bullish. The question is whether or not we can continue to send the market higher, or do we sputter at this level yet again? If we do pull back from here, the 50 Day EMA sits at the 1.3472 level, and is rising. If we were to break down below that level, then the market could go looking at the 1.34 handle underneath, which has been significantly support multiple times. Anything below that level could have this market really start to sell off to reach toward the 200 Day EMA.

Keep in mind that the British pound fared better against the US dollar than most other currencies over the previous year or so, and therefore I would anticipate that if we start to see the US dollar really sell off, then I think you get a situation where the British pound probably becomes a big winner by default. On the other hand, if we see the US dollar start to strengthen, while the British pound could suffer at the hands of the greenback, it’s very likely that it will suffer less than many of the other major currencies.

Ready to trade our daily GBP/USD Forex forecast? Here’s some of the best forex broker UK reviews to check out.

Christopher Lewis has been trading Forex and has over 20 years experience in financial markets. Chris has been a regular contributor to Daily Forex since the early days of the site. He writes about Forex for several online publications, including FX Empire, Investing.com, and his own site, aptly named The Trader Guy. Chris favours technical analysis methods to identify his trades and likes to trade equity indices and commodities as well as Forex. He favours a longer-term trading style, and his trades often last for days or weeks.

Source link

Visited 1 times, 1 visit(s) today

Related Article

A trader watching a stock price chart closely on a laptop screen.

1 Big Reason I’m Keeping an Eye on Plug Power Stock in 2025

If the hydrogen fuel cell specialist can reach this milestone in 2025, it could trigger a big move in its stock price. Plug Power (PLUG -4.85%) has been one of the most dramatic turnaround stocks on the market in recent months. After dropping by 30% in the first half of 2025, the hydrogen stock has

Gold Analysis 30/09: Index Nears Test of $4,000 (Chart)

Index Nears Test of $4,000 (Chart)

Created on September 30, 2025 Today’s Gold Analysis Overview: The overall of Gold Trend: Strongly Bullish Today’s Gold Support Points: $3,825 – $3,800 – $3,760 Per Ounce. Today’s Gold Resistance Points: $3,880 – $3,930 – $4,000 Per Ounce. Today’s Gold Trading Signals: Sell gold from the resistance level of $3,920, with a target of $3,700

EUR/USD Analysis 30/09: Narrow Ranges Ahead (Chart)

EUR/USD Analysis 30/09: Narrow Ranges Ahead (Chart)

Created on September 30, 2025 EUR/USD Analysis Summary Today Overall Trend: Neutral. Support points for the EURUSD today: 1.1680 – 1.1600 – 1.1540. Resistance points for the EURUSD today: 1.1760 – 1.1820 – 1.1900. EUR/USD Trading Signals: Buy the EURUSD from the support level of 1.1600, target 1.1760, and stop 1.1520. Sell the EURUSD from

Silver Monthly Forecast: October 2025 (Chart)

Silver Monthly Forecast: October 2025 (Chart)

Created on September 30, 2025 Silver started September around the 40.0000 mark, and it appears to be getting ready to challenge the 50.0000 ratio as the month of October begins. Silver traded in a sideways manner during the month of August and its highs flirting with marks slightly above the 39.1700 level were below the

At the interbank foreign exchange, the rupee opened at 88.73 against the dollar and traded in the range of 88.69-88.80 before settling at 88.79 (provisional), lower by 4 paise against its previous close. File.

Rupee falls 4 paise to fresh low of 88.79 against U.S. dollar

At the interbank foreign exchange, the rupee opened at 88.73 against the dollar and traded in the range of 88.69-88.80 before settling at 88.79 (provisional), lower by 4 paise against its previous close. File. | Photo Credit: Reuters The rupee fell 4 paise to an all-time low of 88.79 (provisional) against the U.S. dollar on

USD/ZAR Monthly Forecast: October 2025 (Chart)

USD/ZAR Monthly Forecast: October 2025 (Chart)

Created on September 30, 2025 As the month of October gets ready to start, backers of the South African Rand can actually point to the currency as one of the best performing majors against the USD. The USD/ZAR is near the 17.25250 mark early this morning with its always wide spread being displayed, and the

Past shutdowns have not had a major negative impact on stocks, says Jim Cramer

Jim Cramer says government shutdown won’t have a big impact on the market

CNBC’s Jim Cramer on Monday told investors why he believes that a government shutdown won’t have a major effect on the market, looking back at how stocks have reacted to shutdowns in the past. He said his primary concern is that the shutdown will delay the release of key economic data that informs the Federal