Quick overview
- Investors are closely monitoring the upcoming U.S. CPI release to determine if April’s inflation increase was temporary or indicative of a longer trend.
- The ongoing U.S.-China negotiations have created a cautious atmosphere, with analysts interpreting limited signals and Cantor Fitzgerald’s CEO expressing cautious optimism.
- The British pound initially weakened due to disappointing jobs data but recovered by the end of trading, while oil prices struggled to maintain their recent breakout.
- Bitcoin and Ethereum saw renewed interest amid geopolitical tensions, with Bitcoin surpassing $110,000 before retreating, and Ethereum gaining over 20% since April.
Live BTC/USD Chart
BTC/USD

Investors are watching this week’s U.S. CPI release closely for signs of whether April’s inflation uptick was a blip—or the start of a longer tariff-driven trend.
Markets Watch US-China Dialogue While Signals Remain Sparse
With global focus fixed on the ongoing US-China negotiations in London, financial headlines were limited. The atmosphere mirrored a papal conclave, with analysts reading between the lines for direction. Late in the day, Cantor Fitzgerald CEO Howard Lutnick voiced measured optimism about the talks, although he acknowledged that negotiations could stretch into another session.
While foreign exchange markets showed little enthusiasm in response, broader markets responded differently—interpreting the update as a subtle green light to resume risk appetite. Equities and Bitcoin both attracted renewed buying interest by the session’s end.
Sterling Swings on UK Jobs Data; Oil Struggles to Maintain Breakout
The British pound faced initial weakness following disappointing UK jobs data for May. However, by the close of European trading, most of the losses had been reversed. Uncertainty surrounding the Office for National Statistics’ (ONS) figures and a broadly weaker U.S. dollar contributed to the recovery. Sterling closed the day around 50 pips lower, just under the 1.3500 mark.
Oil prices flirted with a breakout as they touched a two-month high but ultimately lost momentum and turned lower. Despite this, the Canadian dollar (loonie) found support on speculation about a potential U.S.-Canada trade agreement ahead of the G7 summit.
The Energy Information Administration (EIA) held steady on its 2025 U.S. oil output forecasts, even amid falling prices. Meanwhile, the World Bank issued a warning about downside risks to global growth in the second half of the year.
Wednesday Forex Outlook – US Inflation Expectations Center Stage Ahead of Key CPI Data
Markets are now looking ahead to critical U.S. inflation data due later this week. Consensus estimates suggest a slight uptick in the core consumer price index (CPI) on a month-over-month basis to 0.3%, compared to 0.2% previously. The year-over-year figure is expected to rise from 2.3% to 2.5%, while the headline CPI m/m is forecast to remain at 0.2%.
This release will help clarify whether the mild inflationary pressures seen in April—especially linked to tariff adjustments—were transient or mark the beginning of a broader trend. Analysts are especially focused on price movements in sectors like electronics, home goods, and recreational products.
Economists noted that many retailers are mitigating tariff effects through customer retention strategies and tighter inventory controls, helping dampen inflationary spillovers for now.
Last week, markets were slower than what we’ve seen in recent months, with gold retreating as a result, the EUR/USD jumping close to 1.15 but returned back to 1.14 this week, and stock markets continued upward too. The moves weren’t too big, but we opened 37 trading signals in total, finishing the week with 25 winning signals and 12 losing ones.
Gold Holds Ground Amid Consolidation Phase
In the precious metals arena, gold remains in a tight consolidation phase. The 50-day simple moving average, hovering around $3,255, continues to act as strong support. A breakout above the $3,400 level could open the door for a retest of the April highs at $3,500. On the downside, a drop below $3,120 would likely trigger fresh buying interest, reflecting the metal’s role as a safe-haven amid uncertainty.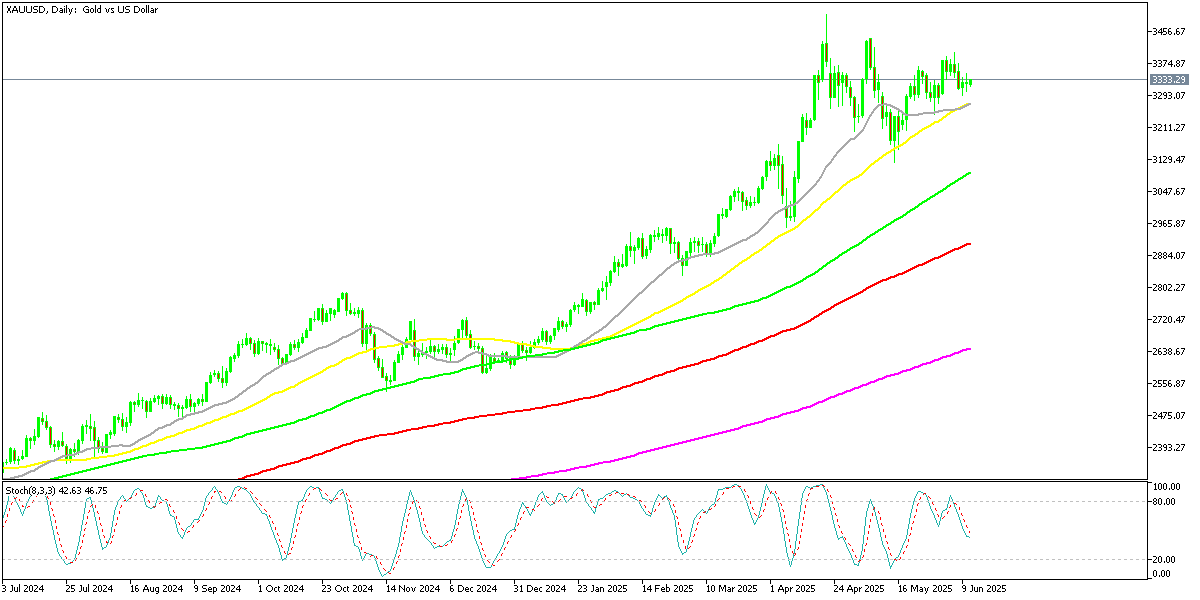
USD/JPY Runs into the 50 Daily SMA
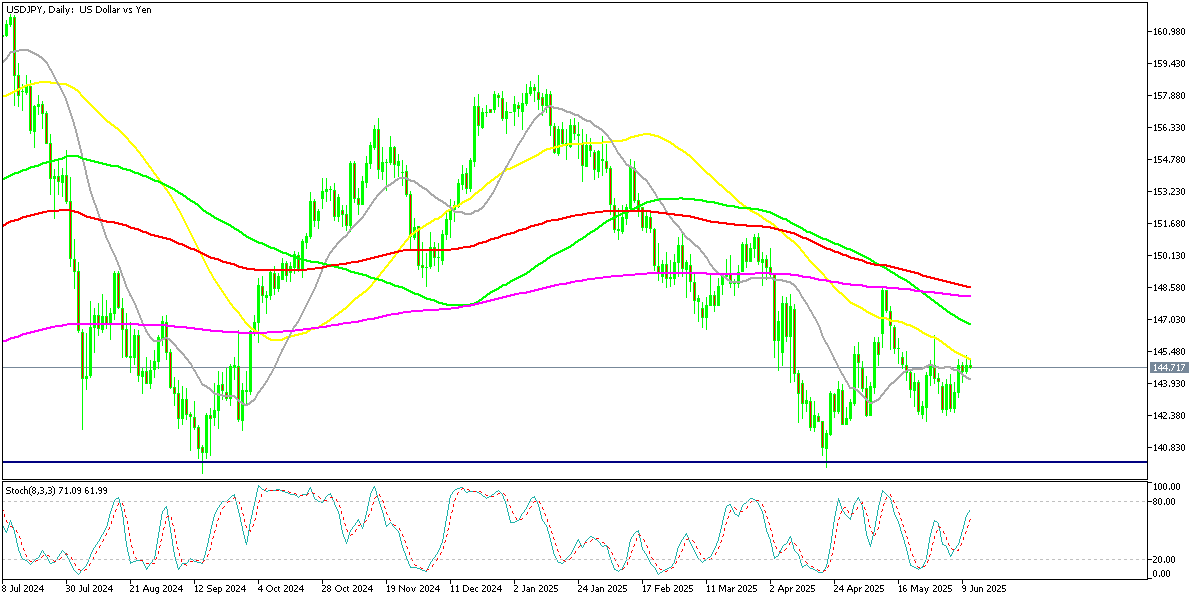
USD/JPY – Daily Chart
Cryptocurrency Update
Bitcoin and Ethereum Reflect Broader Macro Anxiety
Bitcoin surged past the $110,000 mark earlier in the week, gaining over 6% as investors sought alternatives amid geopolitical tension, rising debt levels, and U.S. economic uncertainty. However, the rally lost steam at the 20-day moving average, with BTC sliding back to around $100,000.
BTC/USD – Daily chart
Ethereum Retests the 200 SMA
Ethereum also participated in the uptrend, gaining over 20% since April, supported by renewed institutional enthusiasm following the successful rollout of the Pectra upgrade. The enhancement—focused on improving wallet functionality and staking operations—has added both technical momentum and longer-term utility appeal to Ether. Nonetheless, the 200-day SMA remains a key resistance level, with ETH/USD seeing rejection from that threshold in its latest attempt to climb higher.
ETH/USD – Daily Chart
Skerdian Meta
Lead Analyst
Skerdian Meta Lead Analyst.
Skerdian is a professional Forex trader and a market analyst. He has been actively engaged in market analysis for the past 11 years. Before becoming our head analyst, Skerdian served as a trader and market analyst in Saxo Bank’s local branch, Aksioner. Skerdian specialized in experimenting with developing models and hands-on trading. Skerdian has a masters degree in finance and investment.