Quick overview
- US stock markets are closed today, leading to thin liquidity and potential unexpected price spikes.
- The US dollar initially gained strength, particularly against the yen, but faced mixed trading ahead of the non-farm payroll report.
- Euro volatility was driven by concerns over upcoming US-EU trade negotiations, with potential tariff escalations causing investor nervousness.
- In the cryptocurrency market, Bitcoin rebounded after briefly falling below $100,000, while Ethereum has been outperforming due to institutional support.
Live BTC/USD Chart
BTC/USD

Today US stock markets are closed and slow, but the liquidity will be thin, so we might see an unexpected spike.
Mixed Trading for the Dollar Ahead of NFP Report
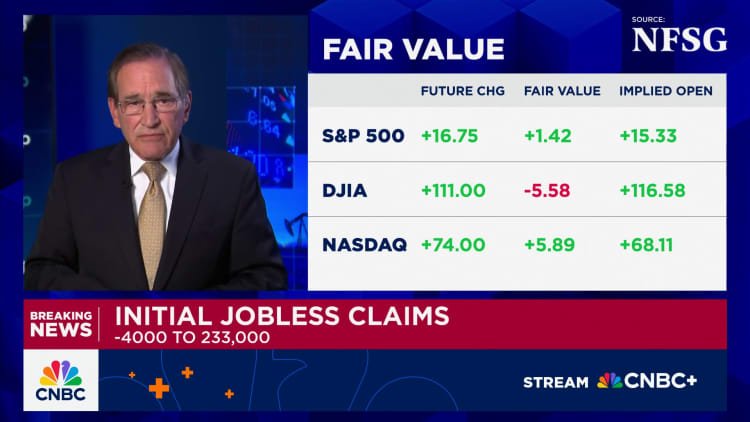
The headline figure in the jobs report looked solid, but beneath the surface some details were less encouraging, keeping traders on edge before the closely watched non-farm payrolls release. Anxiety was already elevated after Wednesday’s disappointing ADP employment numbers, which had shaken confidence in labor market strength.
Dollar Gains Led by USD/JPY
The US dollar initially strengthened broadly, with USD/JPY in particular surging between 40 and 100 pips during the session. While gains against the pound and commodity-linked currencies were quickly reversed, USD/JPY held onto a solid 100-pip increase. Trading volume thinned out later in the day as US markets wound down ahead of the Independence Day holiday.
Euro Volatility Highlights Tariff Jitters
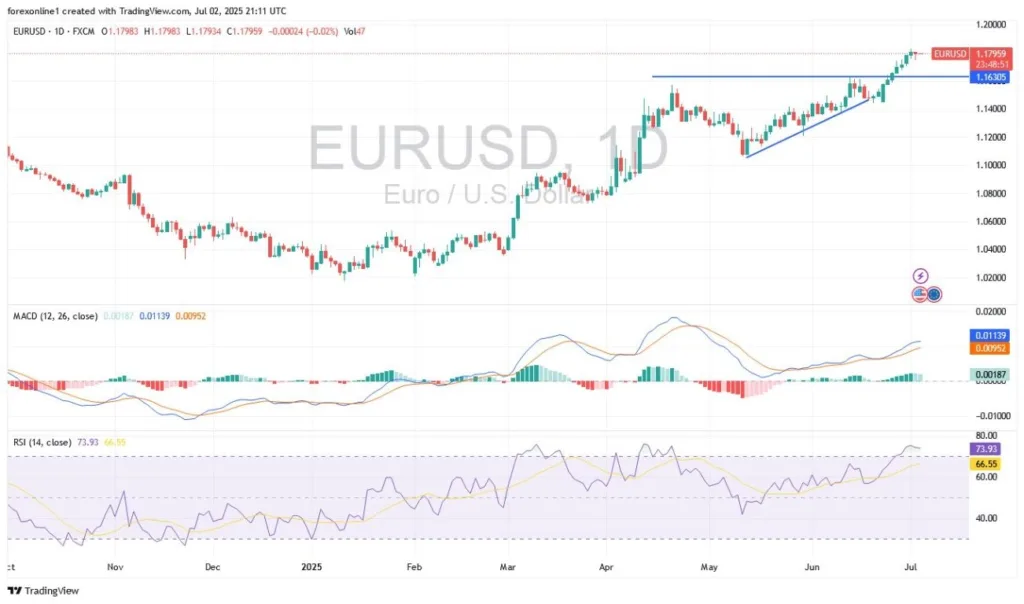
EUR/USD saw a volatile session, dropping sharply on the NFP headline from around 1.1780 to 1.1720 before staging a two-hour rebound. However, selling pressure returned, sending the pair back to 1.1750. Part of this selling may reflect investor nervousness about upcoming trade negotiations between US and EU officials this weekend, with markets wary of potential tariff escalations. Given the heated rhetoric—including expected outbursts on Truth Social—it’s hard to see a smooth resolution emerging without drama.
Trade Policy Uncertainty Weighs on Sentiment
Late in the day, Treasury Secretary Scott Bessent added some detail to the trade picture, revealing that roughly 100 countries would face new 10% tariff rates under the administration’s latest plan. While markets will be watching closely to see how these measures are implemented, there’s a growing view that trading partners may have little choice but to accept the new competitive landscape rather than risk escalation.
Today’s Market Events
Today US markets are closed and the economic event to drive markets around in the European session are light. We have the German Factory Orders which are expected to fall by -0.2% in June, while the French Industrial Production is expected to grow by 0.4% after falling -1.4% previously. The UK Construction PMI is expected to improv slightly s well to 48.6 points, but that’s still in contraction.
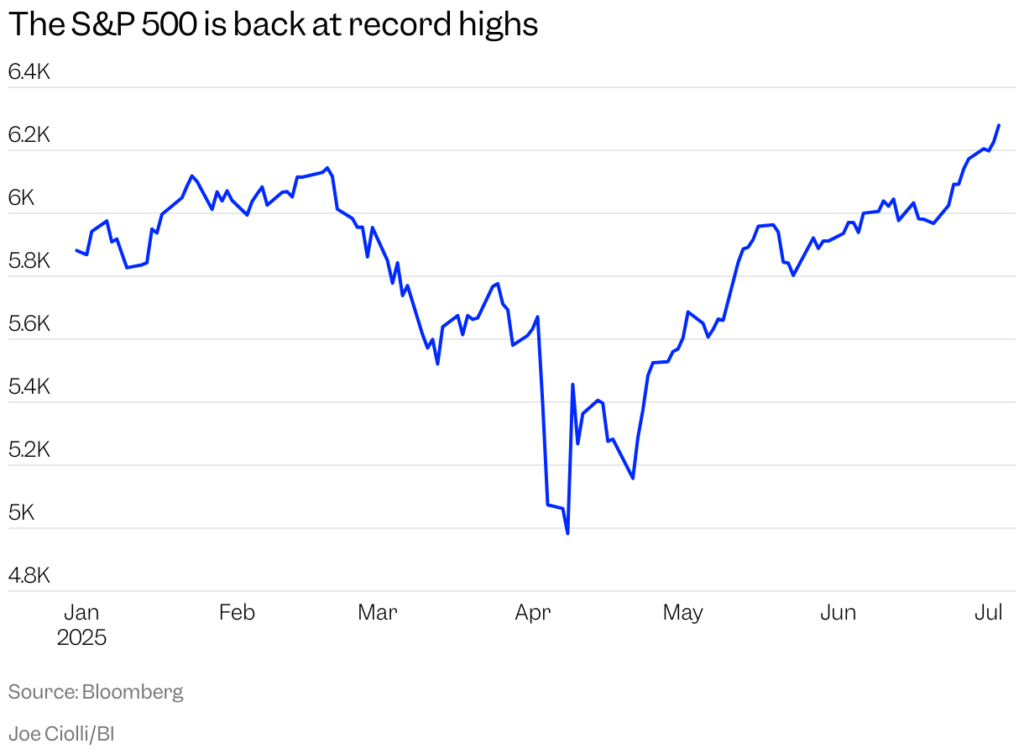
Last week, markets were slower than what we’ve seen in recent months, with gold retreating as a result, the EUR/USD jumping above 1.18 but returned back below it, while S&P and Nasdaq retreated yesterday, but Dow Jones kept pushing higher. The moves weren’t too big though, and we opened 35 trading signals in total, finishing the week with 23 winning signals and 12 losing ones.
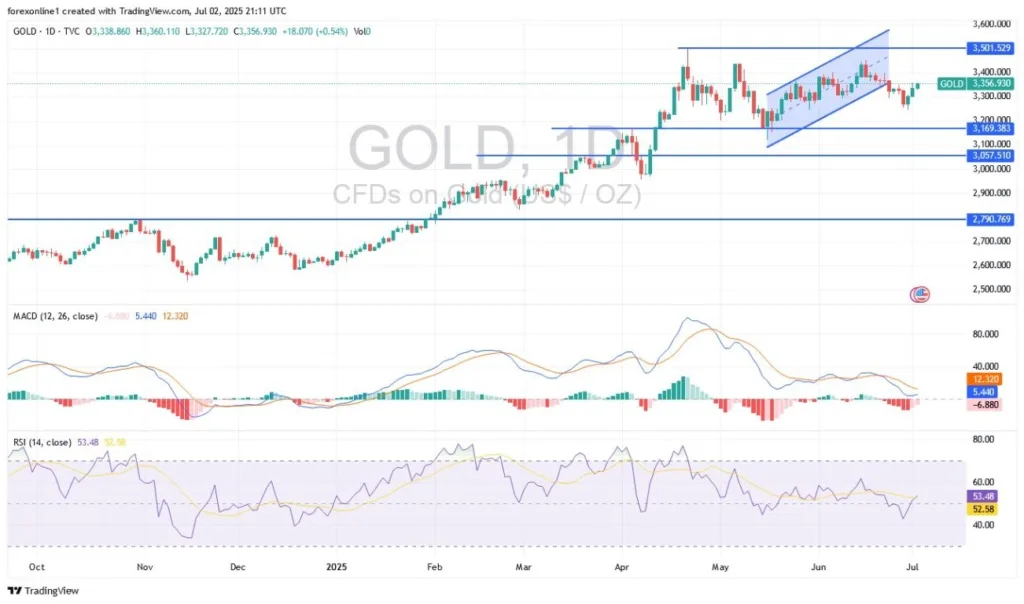
Gold Sticks to the 50 Daily SMA
After its dramatic rally in April to a record high near $3,500 per ounce, gold has managed to bounce back this week despite recent setbacks. The metal had staged a sharp reversal that sliced through the key 50-day simple moving average—a level that had served as reliable support for nearly a year.
That breakdown signaled fading bullish momentum and raised the risk of deeper declines. Traders have since shifted their focus to the 100-day SMA, hovering near $3,150, as the next critical support level. Despite those technical warnings, buying interest has resurfaced this week, hinting at potential stabilization if the rebound holds.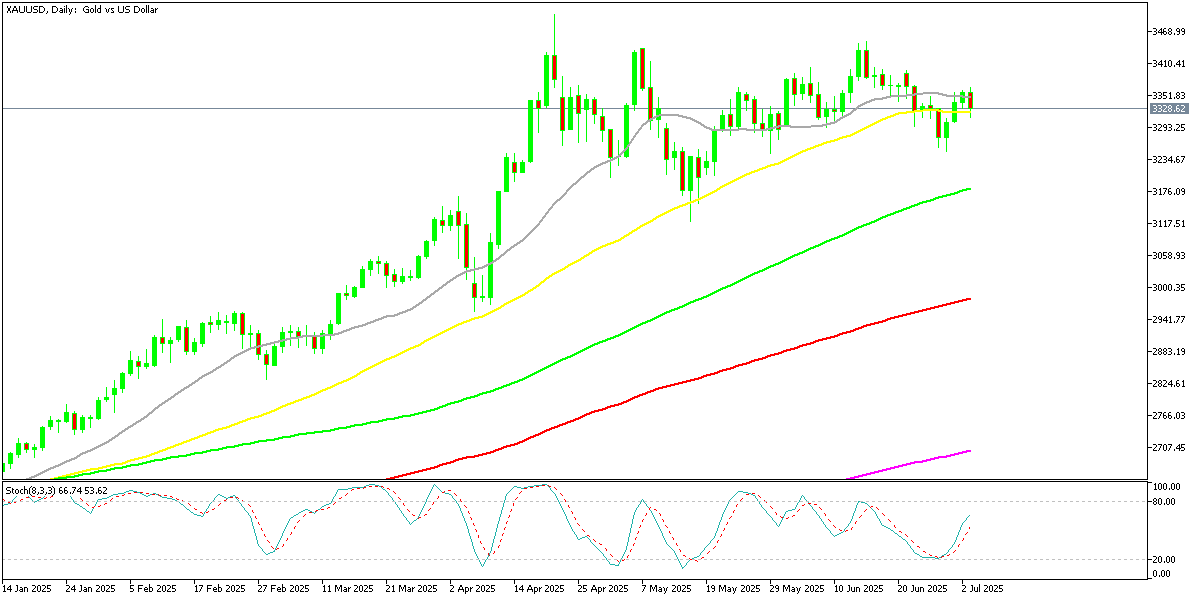
USD/JPY: Resistance Holds Despite Yield Chasing
Meanwhile, the foreign exchange markets continue to exhibit significant volatility. The USD/JPY pair surged from 143.40 to 148 earlier in the week, even though interest rate differentials remained largely unchanged.
Analysts attribute the move to ongoing global yield-chasing and capital outflows from Japan, which have supported the yen’s weakening. However, the pair once again ran into stiff resistance at its 100-week simple moving average. A meaningful breakout from here may require a broader shift in investor risk sentiment to overcome this technical barrier.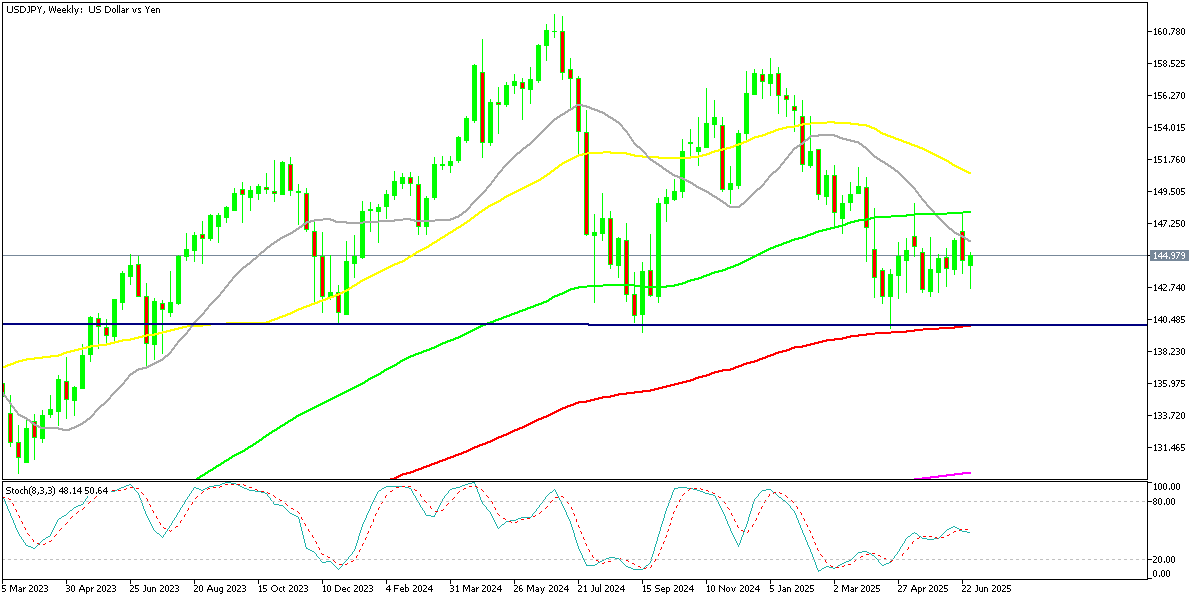
USD/JPY – Weekly Chart
Cryptocurrency Update
Bitcoin Recovers After Breaking Below $100K
Cryptocurrency markets also saw notable turbulence. Bitcoin faced selling pressure earlier in the week, falling through its 50-day moving average and dropping below $104,000—briefly sinking under the $100,000 mark for the first time since early May.
Longer-term investors, however, quickly stepped in around the 20-week simple moving average, sparking a rapid $10,000 rebound that lifted BTC back toward $108,000 by week’s end. This support zone once again proved crucial for maintaining confidence among committed holders.
BTC/USD – Weekly chart
Ethereum Outpaces Bitcoin on Institutional Support
Ethereum has been outperforming Bitcoin in recent weeks, rising more than 20% since April. Much of this strength stems from renewed institutional buying and growing excitement around the upcoming Pectra upgrade.
Technically, ETH is now challenging its 200-day moving average—a level many traders see as pivotal. A decisive break above that mark would open the path toward the $4,000 region, solidifying Ethereum’s leadership over Bitcoin through the summer months and reinforcing its appeal to investors seeking blockchain infrastructure exposure.
ETH/USD – Daily Chart
Skerdian Meta
Lead Analyst
Skerdian Meta Lead Analyst.
Skerdian is a professional Forex trader and a market analyst. He has been actively engaged in market analysis for the past 11 years. Before becoming our head analyst, Skerdian served as a trader and market analyst in Saxo Bank’s local branch, Aksioner. Skerdian specialized in experimenting with developing models and hands-on trading. Skerdian has a masters degree in finance and investment.